


Platinum Setting Up For A Big Price Anomaly
Commodities / Platinum Jun 28, 2019 - 05:41 PM GMTBy: Chris_Vermeulen

 Our clients and followers have been following our incredible research and market calls regarding Gold and Silver with intense focus. We issued a research post in October 2018 that suggested Gold would rocket higher from a base level below $1300 to an initial target near $1450 almost 9 months ago.
As of this week, Gold has reached a high of $1442.90 only $7.10 away from our predicted target level. This has been an absolutely incredible move in Gold and we could not be more pleased with the outcome for our clients, followers, and anyone paying attention to our research posts.
Additionally, many of our clients have been asking us to share our predictive modeling research for Platinum, which has been basing near recent lows recently. We decided to share our research with everyone regarding the information our proprietary predictive modeling tools are suggesting.
You can see from my precious metals comparison article which metal has the most upside potential looking going forward.
Also, be sure you read my exclusive Platinum prediction which is playing out exactly as expected thus far.
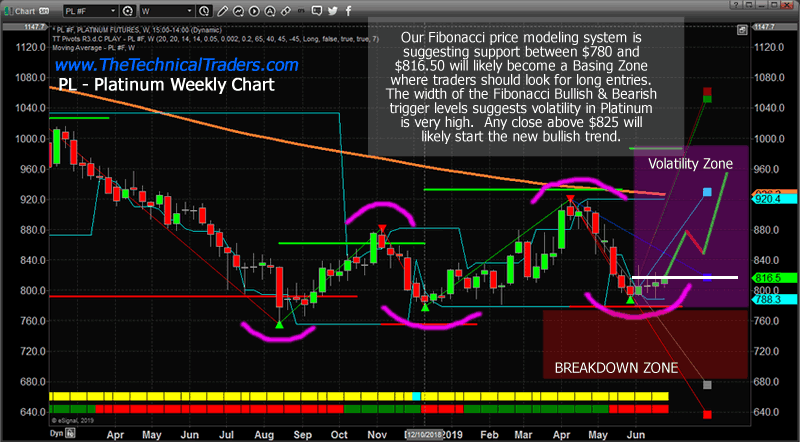
Todays Updated Platinum Analysis: This first Platinum chart highlights our Fibonacci price modeling tool and provides some critical information we need to understand about Platinum right now. The Volatility Zone, created by the range between the Bullish and Bearish Fibonacci Trigger Levels, is very large. This is a very clear indication that implied volatility in Platinum is currently at levels near 26% of the current price. To put that into perspective, an impulse move in Platinum could result in a $125 to $250 price breakout or breakdown, depending on price structure, before implied volatility may reduce back to normal levels. Normal price volatility in Platinum is typically somewhere between 4.6% to 11.5%.
The next aspect of our research we want you to focus on is the rotation of the price peaks and troughs, highlighted by MAGENTA arcs we’ve drawn on this chart. The rotation of price over the past 11+ months has been a very clear “higher price trend channel” where higher highs and higher lows have been forming.
This presents a very clear price picture for the current price levels, near the recent price lows ($765), are very likely to attempt a rally back towards levels that will attempt to set up another “new price high” – $925 or higher. Although, we have to be very cautious of the extended volatility levels and the potential for a price breakdown into the BREAKDOWN ZONE (highlighted on the chart below). Should price fail to attempt to move higher, then a very clear price breakdown will take, breaking the current trend channel and invalidating our bullish price predictions.
Currently, our researchers believe there is a very strong likelihood of an upside price move breaching the $818 level (highlighted by the WHITE LINE near the BLUE Fibonacci projection level) to begin the upside price move. Once this level is breached, we would have technical confirmation that a key Fibonacci level has been tested, breached and a new upside price trend is beginning to form. This would partially validate our upside price expectations and allow us to target a long objective near $865.
Obviously, technical traders would attempt to look for strategic entries below $805, if they present themselves. The concept is to take advantage of the lowest risk trade entries the markets provide. At the same time, there is plenty of room in the middle of this trade for decent profits as well.
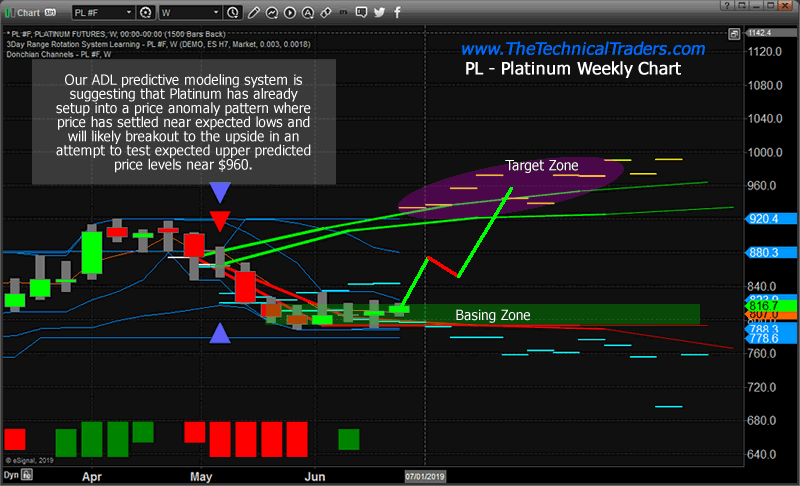
This next chart shows our Adaptive Dynamic Learning (ADL) predictive modeling system that maps out price bars, technical data, and comparative price data into a DNA chain for future reference. In a way, this tool attempts to “infer knowledge” by digging deeper into the price and technical data than we can attempt to do visually – then project the expected price levels well into the future.
This ADL chart is presenting two very clear outcomes. One with much higher prices and another with lower/stagnant pricing levels that tend to weaken over time. This result is the output of two different, side-by-side, price bars and it shows how the ADL can highlight increased volatility and what we call a “price anomaly” pattern that is setting up.
Obviously, the current price is near these lower ADL predicted levels, thus we could assume the lower predicted levels may be more accurate. Yet, both of the ADL bars predicted that price would move lower (below $840) throughout this time-span. Where the ADL predictions diverge is THIS WEEK and into the future. The analysis from April 29 is suggesting that the price of Platinum should be trading near $845 right now and will breakout to much higher levels (above $930) within the next 1 to 3+ weeks. The analysis from May 6 is suggesting that the price of Platinum will languish near $760 to $800 for the next 5+ weeks while continuing to weaken.
This is the setup of a “Price Anomaly”. Where price is actually “out of alignment” with one key element of the ADL predictive modeling system and setting up an incredible opportunity for skilled traders. We’ve learned that either one of two things will happen… Either price WILL revert to much higher levels as suggested by the April 29 ADL prediction OR, the price will stall near recent lows as suggested by the May 6 ADL prediction.
As a skilled trader, our job is to understand where the opportunity lies within this ADL prediction and attempt to manage the risks.
As we stated earlier in this research post, the combination of the Fibonacci and ADL predictive modeling systems are suggesting a very clear action for traders – attempt to accumulate below $800 with the expectation that price may continue to consolidate near these levels for 3 to 10+ more days. Eventually, as our ADL predictive modeling system is suggesting, a breakout upside price move is likely to take place where the price will attempt to move dramatically higher – targeting $850 first, then possibly $935 or higher. This is the “price anomaly reversion” trade that creates the opportunity for skilled traders.
The ADL predictive modeling system is great at suggesting where the price will attempt to target in the near future. When it aligns with the current price, then we have some validation that price is acting normally. When price moves against the suggestions of the ADL predictive modeling system, then we have a “price anomaly setup” and we typically wait for confirmation of the “trigger” to confirm this reversion will actually take place. Our trigger is the WHITE LINE on the Fibonacci chart, above. Once price closes above $818 to $820 on a fairly strong move, then we would have technical confirmation that price is attempting to establish “new price highs” and this should provide enough momentum to push the price anomaly reversion trade into a real opportunity for success.
I urge you visit my Wealth Building Newsletter and if you like what I offer, join me with the 1 or 2-year subscription to lock in the lowest rate possible and ride my coattails as I navigate these financial market and build wealth while others lose nearly everything they own during the next set of crisis’.
I can tell you that huge moves are about to start unfolding not only in metals, or stocks but globally and some of these super cycles are going to last years. A gentleman by the name of Brad Matheny goes into great detail with his simple to understand charts and guide about this. His financial market research is one of a kind and a real eye-opener. PDF guide: 2020 Cycles – The Greatest Opportunity Of Your Lifetime
As a technical analysis and trader since 1997, I have been through a few bull/bear market cycles. I believe I have a good pulse on the market and timing key turning points for both short-term swing trading and long-term investment capital. The opportunities are massive/life-changing if handled properly.
Chris Vermeulen
www.TheTechnicalTraders.com
Chris Vermeulen has been involved in the markets since 1997 and is the founder of Technical Traders Ltd. He is an internationally recognized technical analyst, trader, and is the author of the book: 7 Steps to Win With Logic
Through years of research, trading and helping individual traders around the world. He learned that many traders have great trading ideas, but they lack one thing, they struggle to execute trades in a systematic way for consistent results. Chris helps educate traders with a three-hour video course that can change your trading results for the better.
His mission is to help his clients boost their trading performance while reducing market exposure and portfolio volatility.
He is a regular speaker on HoweStreet.com, and the FinancialSurvivorNetwork radio shows. Chris was also featured on the cover of AmalgaTrader Magazine, and contributes articles to several leading financial hubs like MarketOracle.co.uk
Disclaimer: Nothing in this report should be construed as a solicitation to buy or sell any securities mentioned. Technical Traders Ltd., its owners and the author of this report are not registered broker-dealers or financial advisors. Before investing in any securities, you should consult with your financial advisor and a registered broker-dealer. Never make an investment based solely on what you read in an online or printed report, including this report, especially if the investment involves a small, thinly-traded company that isn’t well known. Technical Traders Ltd. and the author of this report has been paid by Cardiff Energy Corp. In addition, the author owns shares of Cardiff Energy Corp. and would also benefit from volume and price appreciation of its stock. The information provided here within should not be construed as a financial analysis but rather as an advertisement. The author’s views and opinions regarding the companies featured in reports are his own views and are based on information that he has researched independently and has received, which the author assumes to be reliable. Technical Traders Ltd. and the author of this report do not guarantee the accuracy, completeness, or usefulness of any content of this report, nor its fitness for any particular purpose. Lastly, the author does not guarantee that any of the companies mentioned in the reports will perform as expected, and any comparisons made to other companies may not be valid or come into effect.
Chris Vermeulen Archive |
© 2005-2022 http://www.MarketOracle.co.uk - The Market Oracle is a FREE Daily Financial Markets Analysis & Forecasting online publication.