Formula for when the Great Stock Market Rally Ends
Stock-Markets / Stock Markets 2018 Jun 24, 2019 - 05:46 PM GMTBy: readtheticker
 When valuations for the boring water company or the boring electric company is trading like your Facebook, Apple, Amazon or Netflix or Google (ie FANG) you know something is wrong.
This is when a seriously over valued market is screaming at you.
Of course the reader must understand in a world where money printing goes super nuts (Zimbabwe style) the stock market may go hyper inflationary and picking a time frame for a top is never a good idea, but we are not there yet. There is no Ben Bernanke helicopter money to the masses yet (ie MMT).
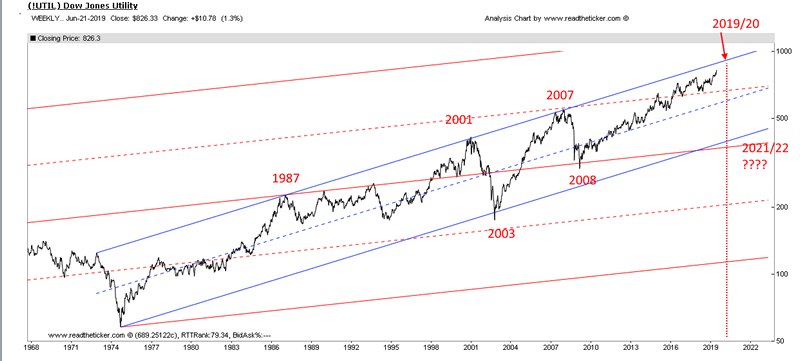
To see when water company's (and such like) are nearing the crazy FANG like valuations a review of the Dow Jones Utility Index channel shows us how history can repeat. The chart below suggest the coming 2020 money boost from the central planners should keep stocks up until 2019/20. Must be an election year, hmmm!
Of course after the recent gold move the SP500 may end up 10% by Dec 2020, but in gold terms it may be flat or down, meaning gold moving higher and faster than the SP500. Of course SP500 moving higher while gold moves higher is good for gold stocks, on a relative strength basis.
The short story is: Happy stock market days should continue into 2020. But watch out for a massive top in the Dow Jones Utility Index as history is likely to repeat as a bear market arrives.
Subject to either of:
1) US/Iran war pushing oil going to $100 and a world recession follows very quickly.
2) Super nuts money printing, Zimbabwe style and Dow Jones to $50,000
3) Deutsche bank blows up Lehman style.
Dow Jones Utility Index History Rhymes.

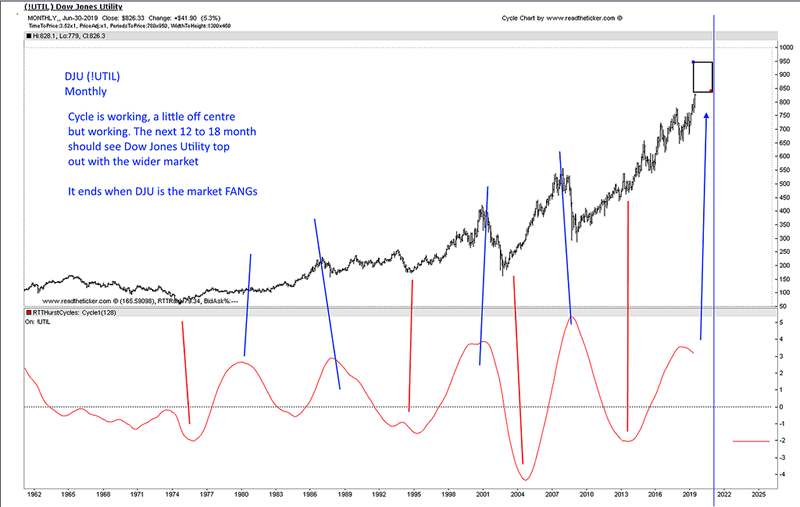
Cycle chart confirms channel forecast top.

Fundamentals are important, and so is market timing, here at readtheticker.com we believe a combination of Gann Angles, Cycles, Wyckoff and Ney logic is the best way to secure better timing than most, after all these methods have been used successfully for 70+ years. To help you applying Richard Wyckoff and Richard Ney logic a wealth of knowledge is available via our RTT Plus membership. NOTE: readtheticker.com does allow users to load objects and text on charts, however some annotations are by a free third party image tool named Paint.net Investing
NOTE: readtheticker.com does allow users to load objects and text on charts, however some annotations are by a free third party image tool named Paint.net
Readtheticker
My website: www.readtheticker.com
We are financial market enthusiast using methods expressed by the Gann, Hurst and Wyckoff with a few of our own proprietary tools. Readtheticker.com provides online stock and index charts with commentary. We are not brokers, bankers, financial planners, hedge fund traders or investment advisors, we are private investors
© 2019 Copyright readtheticker - All Rights Reserved
Disclaimer: The material is presented for educational purposes only and may contain errors or omissions and are subject to change without notice. Readtheticker.com (or 'RTT') members and or associates are NOT responsible for any actions you may take on any comments, advice,annotations or advertisement presented in this content. This material is not presented to be a recommendation to buy or sell any financial instrument (including but not limited to stocks, forex, options, bonds or futures, on any exchange in the world) or as 'investment advice'. Readtheticker.com members may have a position in any company or security mentioned herein.
© 2005-2022 http://www.MarketOracle.co.uk - The Market Oracle is a FREE Daily Financial Markets Analysis & Forecasting online publication.


