


Fibonacci Support May Signal Bounce in Oil & Stocks
Stock-Markets / Financial Markets 2019 Jun 04, 2019 - 06:25 PM GMTBy: Chris_Vermeulen

 We want to take a moment to point out that a Fibonacci 100% price move setup may prompt an upside price swing over the next few days and weeks. Many traders fail to identify this setup and get caught up in the current price trend. This happens because we lose focus on the fact that price always moves in segments or legs – from one peak or trough to another peak or trough. The process of creating these segments or legs is usually structured in these types of Fibonacci price increment, and Fib targets I have personally found to be the most accurate for spotting profit taking and turning points.
We provide two very clear examples of this type of setup and how it has worked in the past. We urge all traders to understand there are many examples of larger Fibonacci price expansion legs throughout history. These examples of the 100% Fibonacci price leg are unique instances of price movement and, after confirmation of a base/reversal, can become very valid trading signals.
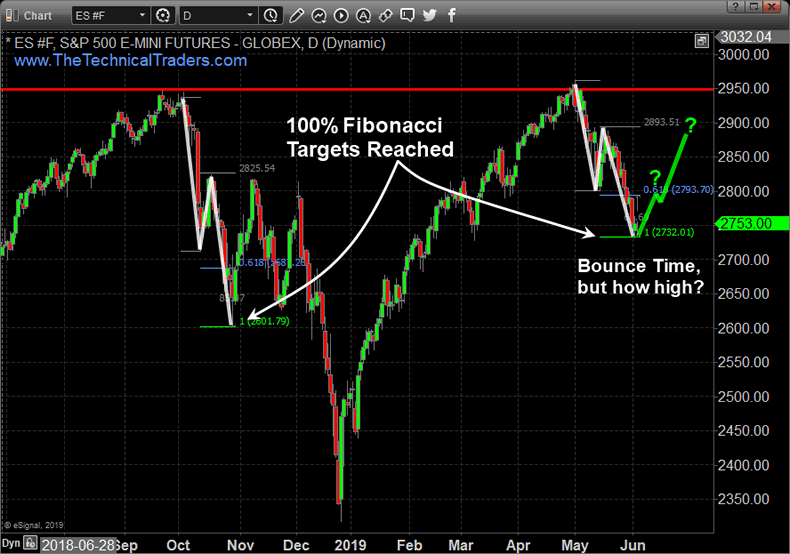
This first example is the ES (E-Mini S&P Futures). You can see from this chart the earlier examples of the 100% Fibonacci price legs working in the October 2018 downward price move. The current downward price legs have set up a perfect 100% Fibonacci price expansion leg and we believe support may form near $2732.
We would normally wait for some type of price confirmation that this level is going to act as support – for example, a solid reversal bar or Japanese Candlestick price pattern. After confirmation is achieved, a price rotation equal to 60% to 95% of the last downward price leg can be expected.
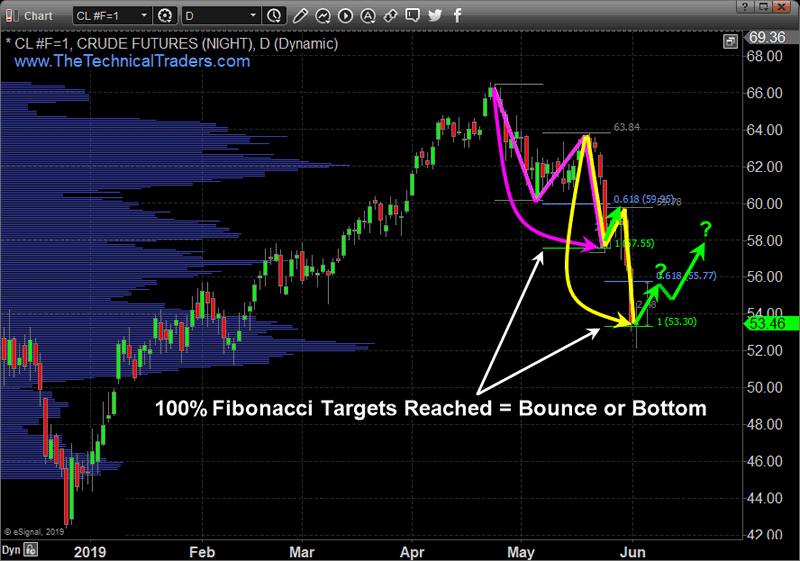
This next example shows Crude Oil and the most recent downward two Fibonacci Price Legs. The first resulted in a very quick upside price rotation (highlighted by the green arrow near May 20). The second downside Fibonacci Price Leg just ended near $53.30.
It is our belief that Oil will find support near this $53.30 level and rally back above $56 from these lows. The only thing we are waiting for is some type of technical price confirmation of this bottom setup and we can expect a 4% to 8% upside price swing in Crude Oil.
Over the past 21+ months, we’ve highlighted some of the best tools and techniques we use to find great trading signals. This one technique, the Fibonacci 100% Price Expansion Leg, is just one of the tools we use to find trades and targets for our trade alerts for members.
The more one understands how price works and how the markets operate as a Symphony of price actions, one can find opportunities for great trades almost all the time. Skill and experience make the difference when deciding when to trade and what to trade and that’s what we provide.
More eye opening charts on currencies and gold here
We’ve now shown you two different price setups using Fibonacci price theory and the only thing we have to do is wait for a technical price confirmation before finding our entry trade. We’ll see how this plays out over the next few days and weeks. Remember, we are not proposing these as “major price bottoms”. They are “upside pullback trades” (bounces) at this point. A bullish price pullback in a downtrend.
BECOME A TECHNICAL TRADER TODAY AND TRADE WHAT MATTERS – PRICE ACTION! CLICK HERE
Chris Vermeulen
www.TheTechnicalTraders.com
Chris Vermeulen has been involved in the markets since 1997 and is the founder of Technical Traders Ltd. He is an internationally recognized technical analyst, trader, and is the author of the book: 7 Steps to Win With Logic
Through years of research, trading and helping individual traders around the world. He learned that many traders have great trading ideas, but they lack one thing, they struggle to execute trades in a systematic way for consistent results. Chris helps educate traders with a three-hour video course that can change your trading results for the better.
His mission is to help his clients boost their trading performance while reducing market exposure and portfolio volatility.
He is a regular speaker on HoweStreet.com, and the FinancialSurvivorNetwork radio shows. Chris was also featured on the cover of AmalgaTrader Magazine, and contributes articles to several leading financial hubs like MarketOracle.co.uk
Disclaimer: Nothing in this report should be construed as a solicitation to buy or sell any securities mentioned. Technical Traders Ltd., its owners and the author of this report are not registered broker-dealers or financial advisors. Before investing in any securities, you should consult with your financial advisor and a registered broker-dealer. Never make an investment based solely on what you read in an online or printed report, including this report, especially if the investment involves a small, thinly-traded company that isn’t well known. Technical Traders Ltd. and the author of this report has been paid by Cardiff Energy Corp. In addition, the author owns shares of Cardiff Energy Corp. and would also benefit from volume and price appreciation of its stock. The information provided here within should not be construed as a financial analysis but rather as an advertisement. The author’s views and opinions regarding the companies featured in reports are his own views and are based on information that he has researched independently and has received, which the author assumes to be reliable. Technical Traders Ltd. and the author of this report do not guarantee the accuracy, completeness, or usefulness of any content of this report, nor its fitness for any particular purpose. Lastly, the author does not guarantee that any of the companies mentioned in the reports will perform as expected, and any comparisons made to other companies may not be valid or come into effect.
Chris Vermeulen Archive |
© 2005-2022 http://www.MarketOracle.co.uk - The Market Oracle is a FREE Daily Financial Markets Analysis & Forecasting online publication.