A Brief History of Financial Entropy
Stock-Markets / Financial Markets 2019 May 20, 2019 - 05:21 PM GMTBy: Michael_Pento
 The global economy began an experiment with fiscal and monetary alchemy when it exited the gold standard almost 50 years ago.
In 1971 the USD completely separated from the last vestiges of its tether to gold. In effect, it released the worldwide monetary system from any limitations of base money growth, as it was no longer pegged to the increase in the mine supply of gold. This is because the USD was once linked to gold and the rest of the developed world linked their currencies to the dollar. This was the case ever since The Bretton Woods agreement of 1944.
Therefore, when the U.S. severed the link to gold, the world entered into its doomed experiment with global fiat currencies and began its journey down the road to financial entropy.
A Bit of History
Paul Volcker (Fed Chair from August 1979 thru August 1987) had vanquished the inflation caused by the loose monetary policies of the Johnson and Carter Administrations by the early ’80s. But once again, the recidivism of the Fed led to rising inflation by the middle of the decade. By the first half of 1987 stock markets had been soaring, rising an astonishing 44% by late August. But by mid-October, the federal government disclosed a larger-than-expected trade deficit leading the dollar to fall further in value and markets to unravel. By the end of trading on Friday, October 16th the Dow Jones Industrial Average (DJIA) sank 4.6%. On the following Monday morning, investors in the US awoke to stock markets in and around Asia in free fall. This led the DJIA to crash at the opening bell, eventually plunging 508 points, which amounted to a brutal 22.6% one-day decline. Fed Chairman Alan Greenspan was quick to assure markets his Fed would serve as a source of liquidity and that he would print enough money to support the financial system. He thus encouraged financial institutions not just to remain calm but buy shares with abandon with the full sanction of the central bank.
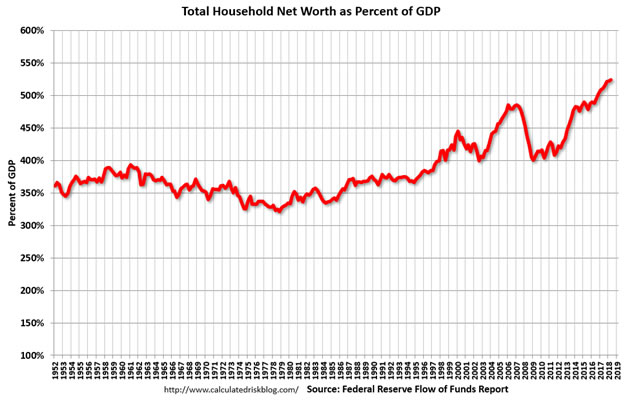
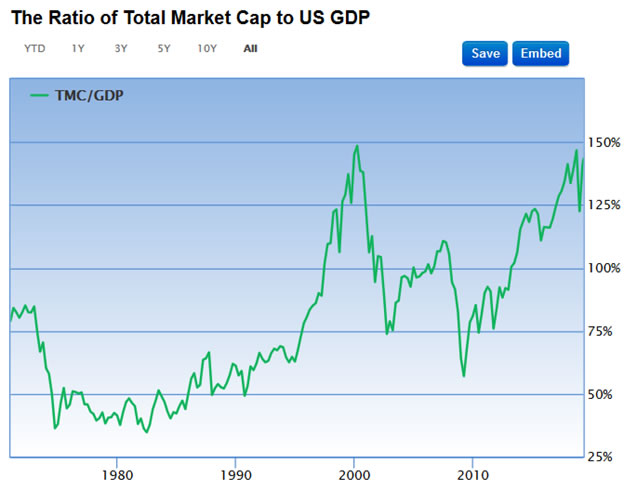
For the first time since its inception in 1913, the Fed wasn’t just coming to the rescue of an individual bank, or even trying to tinker around the edges of stimulating economic growth; Alan Greenspan made it clear that the Fed was now in the business of directly supporting the stock market. The DJIA gained back 288 points in just two trading sessions. Back in 1987, the entire market value of equities made up just 66% of the economy. And Household Net Worth as a percent of GDP was 370%
The late 1990s ushered in new market worries such as the “Asian Contagion.” From 1985 to 1996, Thailand’s economy grew at over 9% per year. But by 1997, it became clear that much of that growth had been predicated on years of rampant credit growth that yielded an abundance of bad loans. There was also a tremendous amount of foreign borrowing of dollar-based loans and other foreign currencies that exposed the Thai economy to exchange rate risks that had been masked by longstanding currency pegs. When those pegs proved unsustainable and were forced to be broken, firms were unable to pay their foreign-denominated debt--leading many into insolvency. This collapse spread like wildfire throughout Asia and caused the IMF to offer a bailout of over $20 billion.
On the heels of the Asian crisis, Russia becomes an issue. Its weak economy, deficits, and reliance on short-term financing caused the outbreak of a severe sovereign debt crisis. In August of 1998, the Russian government shocked markets when it announced it would devalue the ruble and no longer honor its debts; financial chaos ensued. Many governments and financial institutions found themselves on the wrong side of this trade, but none more so than the highly leveraged hedge fund called Long Term Capital Management, which lost $4.6 billion in short order. Fearing a systemic financial meltdown, the Fed once again came to the rescue of markets organizing a bailout by a consortium of 14 financial firms. Of course, all underwritten by the international fiat printing press.
All of that government-sanctioned counterfeiting exacerbated the NASDAQ bubble of 2000, which soon after burst causing tech stocks to lose 78% of their value by the fall of 2002. At the peak of this bubble, the total market cap of equities as a percentage of the economy was no longer 66%, but had grown to 148% of GDP! And, Household Net Worth surged to 450% of GDP.
In the wake of the dot-com collapse, the Fed took interest rates to one percent and left them there for one year—between June 2003 June thru 2004. This engendered the real estate bubble and Great Recession of 2007 thru 2009. Just before the collapse, Household New Worth climbed to a then-record of nearly 490% of GDP.
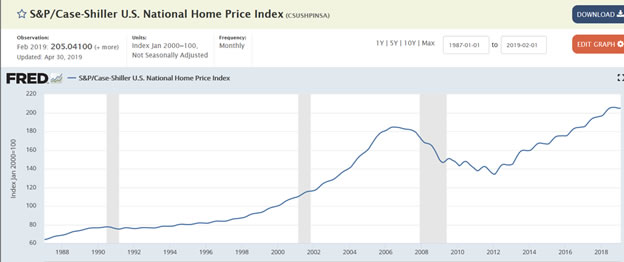
The Fed’s response to that worst crisis since the Great Depression was to cut interest rates from 5.25% in 2007, to virtually 0% by the end of 2008; and kept them pegged there for nearly nine years. It also purchased $3.7 trillion worth of banks’ assets to push those same assets back into another bubble. This latest iteration of central bank mania has placed the economy in the position of enduring three great bubbles concurrently for the first time in history (real estate, equities, and bonds). Consequently, not only are stocks valuations back towards 1.5 times the economy but home prices are overvalued by about 35%; along with bond prices that are so distorted that governments are getting paid to borrow money. This current bubble has caused Household Net Worth as a percent of GDP to skyrocket to a record 535%!
From Order to Chaos
The salient issue is that each crisis was ameliorated by printing more money and pushing borrowing costs significantly lower than where the free market would have demanded. Rising rates would normally have cut off access to the cheap credit that keeps non-viable businesses afloat. Recessions are healthy in that they purge the economy of its malinvestments. However, by its systemic practice of artificially suppressing interest rates with increasing distortions, central banks have created massive misallocations of capital that have produced unprecedented levels of debt and asset bubbles.
As a result of this, Household Net Worth as a percentage of GDP is now 50% higher than its historical average.

A significant component of Household Net Worth is stock valuations. As you can see from the chart below, we are now at altitudes only once before ascended during the thin air of the tech bubble.

Another important component of Household Net Worth is real estate values. Here we find that US home prices have far exceeded their bubble-highs set 13 years ago at the peak of the real estate bubble.

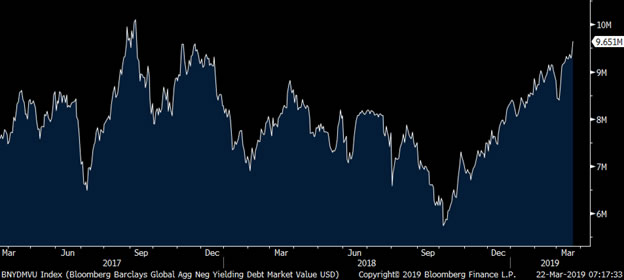
Add to this calculation the price of bonds, which includes $10 trillion worth of sovereign debt with a negative yield, and you get the trifecta of the everything bubble. It was previously unfathomable to have even one dollar’s worth of negative yielding debt prior to the Great Recession.

The major consequence of all this is that the valuation of assets has now become far bigger than the underlying economy and therefore can very easily bring the whole charade crashing down.
The amount of subprime mortgage debt before the Real Estate bubble collapsed was just shy of $1.5 trillion--its demise brought down the entire global economy. Compare that figure to the amount of “sub-prime” corporate debt, and you can understand the scope of just one of these asset price distortions. When you add the total of junk bonds and leveraged loans together, you come up with a figure of $2.8 trillion. Then, if you count the surging $2.6 trillion level of BBB debt, which is just one notch above junk, you come up with a figure of $5.4 trillion worth of extremely economically sensitive business debt. By the way, this does not imply that over leveraging can only be found in business debt; as of Q1 2019 there is a record $13.6 trillion of household debt outstanding, which is nearly one trillion dollars more than the previous peak in Q3 2008. Therefore, even a small contraction in GDP could quickly snowball into an avalanche of defaults and economic chaos.
The key point here is that when the total value of equities was roughly half of GDP like it was from the mid-'70s thru the mid-'90s; the economy was able to lead the stock market. But, when money printing pushes stocks to become 1.5x the value of the economy, it is stocks that then lead GDP. Likewise, when Household Net Worth was 370% of GDP, asset prices were more a function of economic growth. But with asset prices now at 535% of GDP, it is asset prices that pull the economy. Hence, keeping equities in a bubble is now mandatory because a fall in the market can easily bring down the economy and also any political leader that happens to be in charge. Donald Trump is keenly aware of this fact. But in truth, all those in power are cognizant to this fact as well. We saw an example of this in Q4 2018 when the junk bond market froze for 41 days without any new issuance, and stock prices entered into a bear market. The Fed quickly abandoned its rate hiking plans and promised to truncate its QT program.
But, of course, this bubble just doesn’t belong to the U.S. According to Kyle Bass, the banking system of Hong Kong has now exploded to become 8.5x the island nation’s GDP. Its neighbor, China, has a massive and unproductive $40 trillion worth of debt that has quadrupled since 2007. Japan's economy would crash in epoch fashion if the Bank of Japan (BOJ) ever began to step away from its asset bubble support. The quadrillion yen Japanese government bond market (JGBs) would become insolvent without its primary buyer the BOJ—it now owns over 50% of the entire JGB market. The BOJ also already has possession of nearly 80% of the ETF market. Therefore, at the first hint that the Japanese government was to begin removing its bid for stocks it would most likely cause the NIKKEI Dow to plunge in a manner that makes its spectacular crash of 1989 look like a bull market.
In other words, the power that once existed within free markets has now been completely usurped by governments and central banks. These abrogators of freedom have gone all-in with their price manipulations and are now forced to perpetually engage in debt monetization, or risk a global asset price meltdown that would almost certainly engender a depression worldwide. This is the truth as to why Wall Street cares very little about earnings and the economy and instead has become completely focused upon every word that proceedeth out of the mouth of a central banker.
The linking of money to gold was a spark of human genius, but it was also the avarice nature of mankind that eventually destroyed it. The inevitable and dire consequences of which are high.
Michael Pento produces the weekly podcast “The Mid-week Reality Check”, is the President and Founder of Pento Portfolio Strategies and Author of the book “The Coming Bond Market Collapse.”
Respectfully,
Michael Pento
President
Pento Portfolio Strategies
www.pentoport.com
mpento@pentoport.com
(O) 732-203-1333
(M) 732- 213-1295
Michael Pento is the President and Founder of Pento Portfolio Strategies (PPS). PPS is a Registered Investment Advisory Firm that provides money management services and research for individual and institutional clients.
Michael is a well-established specialist in markets and economics and a regular guest on CNBC, CNN, Bloomberg, FOX Business News and other international media outlets. His market analysis can also be read in most major financial publications, including the Wall Street Journal. He also acts as a Financial Columnist for Forbes, Contributor to thestreet.com and is a blogger at the Huffington Post.Prior to starting PPS, Michael served as a senior economist and vice president of the managed products division of Euro Pacific Capital. There, he also led an external sales division that marketed their managed products to outside broker-dealers and registered investment advisors.
Additionally, Michael has worked at an investment advisory firm where he helped create ETFs and UITs that were sold throughout Wall Street. Earlier in his career he spent two years on the floor of the New York Stock Exchange. He has carried series 7, 63, 65, 55 and Life and Health Insurance www.earthoflight.caLicenses. Michael Pento graduated from Rowan University in 1991.
© 2019 Copyright Michael Pento - All Rights Reserved
Disclaimer: The above is a matter of opinion provided for general information purposes only and is not intended as investment advice. Information and analysis above are derived from sources and utilising methods believed to be reliable, but we cannot accept responsibility for any losses you may incur as a result of this analysis. Individuals should consult with their personal financial advisors.
Michael Pento Archive |
© 2005-2022 http://www.MarketOracle.co.uk - The Market Oracle is a FREE Daily Financial Markets Analysis & Forecasting online publication.


