This Indicator Signals the US Economy Is Slowing Down
Economics / US Economy Apr 30, 2019 - 04:40 PM GMTBy: Patrick_Watson

 It’s not a good sign for your health if your blood pressure drops too low. Similarly, the economy is probably sick when its circulatory system slows down.
You don’t need a blood pressure gauge to know it either. Just count how many trucks you see on the highway.
Under normal conditions, busy highways and seaports mean a growing economy. Businesses are producing more stuff finding its way to consumers.
That was happening since we emerged from the Great Recession in 2009, albeit slower than in the past cycles.
This Indicator Signals the US Economy Is Slowing Down
Now with freight traffic dropping, the economy could soon get dizzy… and we’ll all feel it then.
Rush to Import
When the trade war picked up steam, something unexpected happened. Freight volumes shot up.
Anyone who was paying attention knew by mid-2018 that American buyers were going to pay more for imported goods.
US businesses responded by rushing to import as much as possible before tariffs (i.e., taxes) rose even higher. Hence the Overheated Highways I wrote about in May.
Note, this wasn’t new demand. It was the same goods in the same amounts companies would have bought later on. They just bought them sooner in order to avoid tariffs.
When businesses moved up their import purchases, it meant they would import less in the future.
Cargo Volumes Decline
Now the future is here. Warehouses are full, and cargo traffic is slowing. Here are a few telltale headlines, just from this month.
- Truckers Cut Payrolls As Freight Demand Softens (Wall Street Journal, April 5, 2019)
- German Exports Drop More Than Forecast (Financial Times, April 8, 2019)
- Airports See Cargo Volumes Decline Further in February (Air Cargo News, April 9, 2019)
That last story is particularly disturbing. It shows the same pattern unfolding in Asia and Europe as well as North America.
Lower bookings have made container spot rates from Asia to North Europe drop 36% this year. Reducing mining output in Brazil is making some companies send older ships to scrapyards.
The March NFIB Small Business Optimism Index showed a drop in the number of business owners who viewed inventories as too low, as well as reduced expansion plans. That may explain some of this decline.
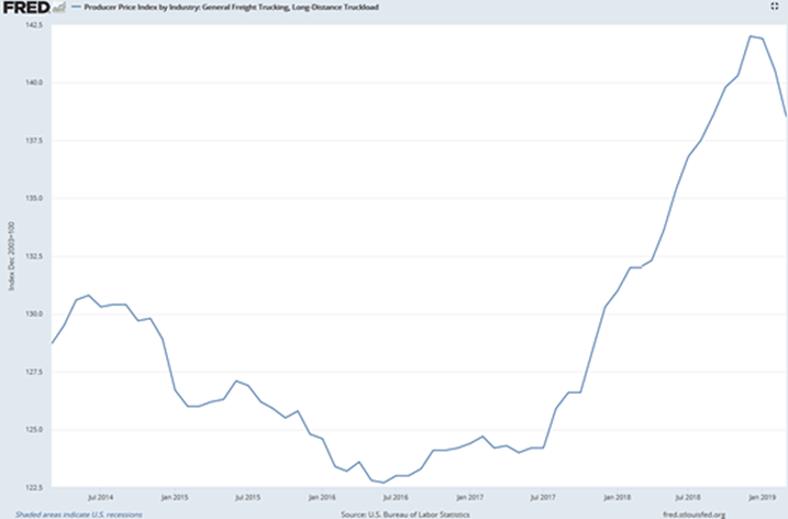
Then there’s the latest Producer Price Index data. Here’s the PPI sub-index of trucking costs:

Chart: St. Louis Fed
You can see trucking costs climbed like crazy from mid-2017 through the end of 2018. Now they’re reversing downward.
The last time that happened was late 2014, when oil prices crashed. The US had a kind of mini-recession over the next year.
The next time may not be so “mini.”
Economic Heartbeat
People who monitor this data closely are getting concerned. Annual growth in the widely respected Cass Freight Index, which tracks North American freight shipments, dropped in the last four consecutive months.
The editors, who weren’t too bothered by the first three declines, said this in their latest report:
As we try to navigate the ebb and flow of the economy, we don’t pretend to have any ‘secret sauce’ or incredibly complex models that have exhaustively analyzed every data point available. Instead, we place our trust in the simple notion that the movement of tangible goods is the heartbeat of the economy, and that tracking the volume and velocity of those goods has proven to be one of the most reliable methods of predicting change because of the adequate amount of forewarning that exists…
Beyond our concern that the Cass Freight Shipments Index has been negative on a YoY basis for the fourth month in a row,
• We are concerned about the severe declines in international airfreight volumes (especially in Asia) and the recent swoon in railroad volumes in auto and building materials;
• We are reassured by the sequential increase in the Cass Freight Shipments Index (up 2.0%) and the volumes in U.S. domestic trucking (especially in truckload dry van);
• We are closely watching the volumes of chemicals and other shipments via railroad, as they have lost momentum in recent weeks and may give us the first evidence of the global slowdown spreading to the U.S.
Bottom line, the data in coming weeks will indicate whether this is merely a pause in the rate of economic expansion or the beginning of an economic contraction. If a contraction occurs, then the Cass Shipments Index will have been one of the first early indicators once again.
I have said before that we’ve reached Peak Globalization and the flow of physical goods will lose importance in the future. But for now, it’s still critical. The Cass data ought to concern everyone.
If cargo movement really is the “heartbeat of the economy,” like Cass says, the economy should probably consult a cardiologist. This problem may get worse before it gets better.
The Great Reset: The Collapse of the Biggest Bubble in History
New York Times best-seller and renowned financial expert John Mauldin predicts an unprecedented financial crisis that could trigger in the next five years. Most investors seem completely unaware of the relentless pressure that’s building right now. Learn more here.
By Patrick_Watson
© 2019 Copyright Patrick_Watson - All Rights Reserved
Disclaimer: The above is a matter of opinion provided for general information purposes only and is not intended as investment advice. Information and analysis above are derived from sources and utilising methods believed to be reliable, but we cannot accept responsibility for any losses you may incur as a result of this analysis. Individuals should consult with their personal financial advisors.
© 2005-2022 http://www.MarketOracle.co.uk - The Market Oracle is a FREE Daily Financial Markets Analysis & Forecasting online publication.


