


If This Pattern Holds True, the US Economy Could Face the Worst Stagnation in History
Economics / Great Depression II Apr 25, 2019 - 12:59 PM GMTBy: John_Mauldin

 I recently made a case that the Fed’s monetary policy is turning Japanese. Let’s examine how that worked for them.
From one perspective, it has done quite well. From another, they have paid a cost.
Is it worth it? I think many Japanese, likely a big majority, would say yes.
An Economic Miracle?
The Bank of Japan has more than 140% of Japanese GDP on its balance sheet.
Its laws let it buy equities not just in Japan but all over the world and it did. Yet the currency is roughly the same value as it was when the Bank of Japan got busy with that project.
Many analysts, including myself, said that Japan is going to print money and the currency will lose value.
Instead, it brought one of the most surprising macroeconomic outcomes that I could imagine. Talk about thinking the unthinkable back in 2008. What happened is unthinkable to me, and to a lot of other people.
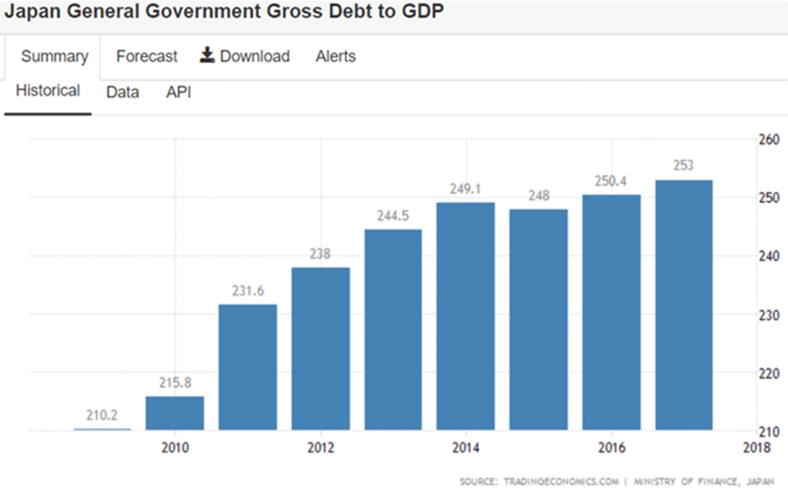
First, let’s take a look at Japanese debt-to-GDP, which has risen to 253%:
For the last two decades, the Japanese have pledged they would balance their budget in 7 to 10 years—and they’re actually beginning to make progress.
Their fiscal deficit is in fact smaller every year in terms of GDP and actual numbers of dollars:
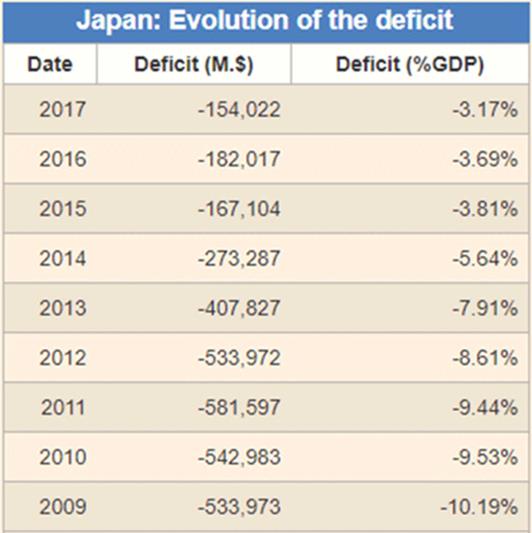
Source: Countryeconomy.com
Good for them.
The deficit should fall even further as they have a small sales tax increase kicking in the fall of this year.
It is not clear whether they will actually implement the tax, but I expect them to eventually do so.
And sometime in the next decade, Japan could actually have a balanced budget, and then a surplus that lets the government begin paying down that debt.
Of course, they have to navigate global recessions, but they are clearly trying to move in the correct direction.
Kudos to Abe and Kuroda-san.
The Cost of High Debt
All this has not been without cost. It brought severe financial repression on savers.
If you could somehow buy a new Japanese government bond, which is almost impossible because the BOJ buys everything, you would get negative yield.
That’s one reason Japanese savers are not selling their bonds. Even 1–2% on bonds bought “back in the day” is a lot more than they can get now.
The Japanese government bond market was once one of the world’s most liquid. Now it trades by appointment.
Here is the JGB yield curve right now (notice it is negative out to 10 years):
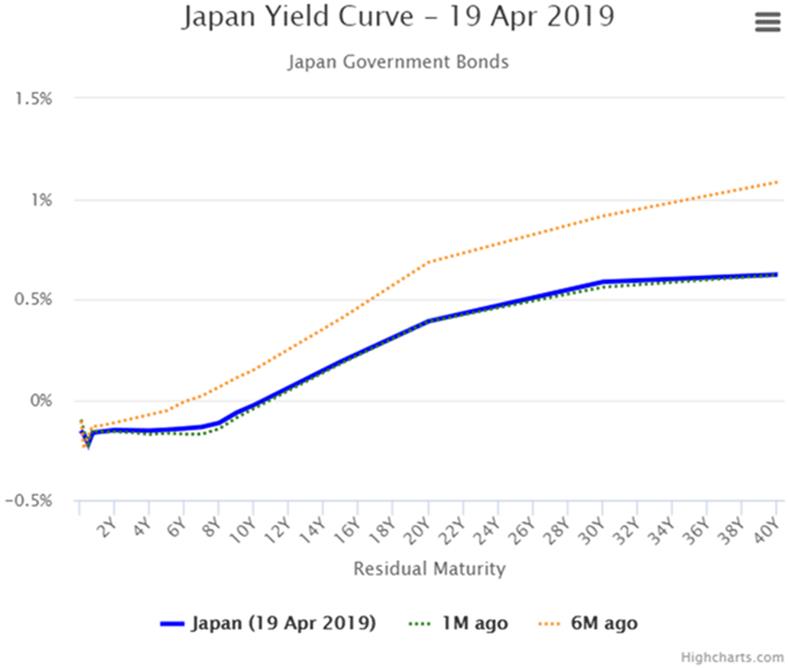
So if somehow you had bought a 20-year bond 10 years ago, you would have a nice capital gain.
But then where would you put the proceeds if you sold? That’s why there are very few actual sales in the Japanese bond market.
High levels of debt reduces interest rates, productivity, and GDP growth, exactly as we see in Japan. They ran massive government debt which has brought future consumption into the then-present.
And now the Japanese must live in a world where that future consumption doesn’t happen, GDP growth is negligible if not negative, and investors have to live by new rules.
To some degree, we already see the first evidence of that in the US.
Euphoria Before the Storm
My good friend Ben Hunt (Chief Risk Officer of Salient Partners, an $18-billion asset manager based in Houston) notes that the S&P 500 companies have the highest earnings relative to sales in history:
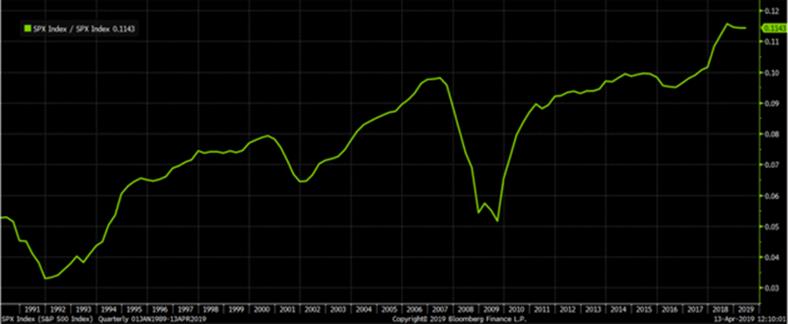
Source: Ben Hunt
Quoting Ben:
This is a 30-year chart of total S&P 500 earnings divided by total S&P 500 sales. It’s how many pennies of earnings S&P 500 companies get from a dollar of sales… earnings margin, essentially, at a high level of aggregation. So at the lows of 1991, $1 in sales generated a bit more than $0.03 in earnings for the S&P 500. Today in 2019, we are at an all-time high of a bit more than $0.11 in earnings from $1 in sales.
It’s a marvelously steady progression up and to the right, temporarily marred by a recession here and there, but really quite awe-inspiring in its consistency. Yay, capitalism!
Ben goes on to say many people think that is because of technology. He argues it is the financialization of our economy and the Fed’s loose policies.
I agree 100%. If you think they haven’t changed the rules since the 1980s and 1990s, you aren’t paying attention, boys and girls!
It goes without saying that those profits are not going to labor and monetary policies that were supposed to enhance the economy.
When you muck around with the markets, don’t be surprised if you get unintended consequences. We have them in spades, and everybody wants to blame “the rich” rather than the incentives the government and Federal Reserve created.
The Great Reset: The Collapse of the Biggest Bubble in History
New York Times best seller and renowned financial expert John Mauldin predicts an unprecedented financial crisis that could be triggered in the next five years. Most investors seem completely unaware of the relentless pressure that’s building right now. Learn more here.
John Mauldin Archive |
© 2005-2022 http://www.MarketOracle.co.uk - The Market Oracle is a FREE Daily Financial Markets Analysis & Forecasting online publication.