


Intel Corporation (INTC) Bullish Structure Favors More Upside
Companies / Tech Stocks Apr 18, 2019 - 10:56 AM GMT

 Intel Corporation (NASDAQ: INTC) is second largest and second highest valued chipmakers in the world. It designs and manufactures microprocessors and platform solutions for the global personal computer and data center markets.
Looking at the company’s Fundamental situation, its return on Total Capital is 23.43 and its Return on Invested Capital has reached 20.60%. Its Return on Equity is 29.33, and its Return on Assets is 16.76. Intel’s year on year earnings growth rate has been positive over the past 5 years and its 1-year earnings growth exceeds its 5-year average (118.2% vs 8.3%).
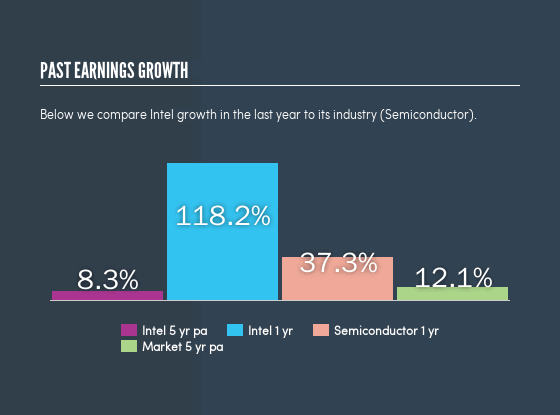
Intel INTC Earning Growth
All the above metrics suggest that Intel is well organized in using the earned money to generate more returns which is reflected on its stock performance as it remains one of investor’s favorite.
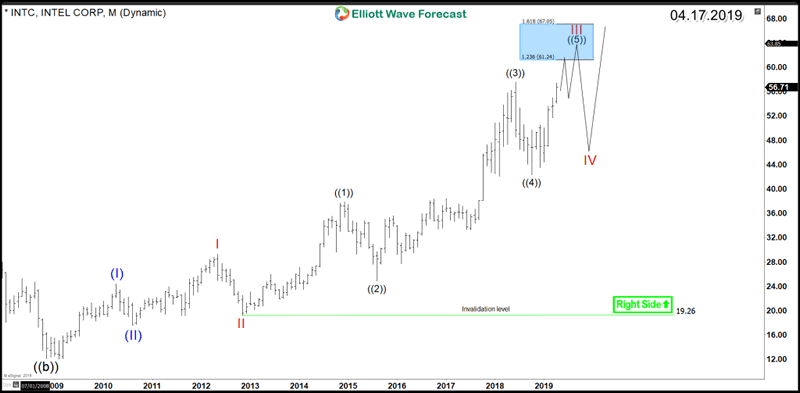
Based on Elliott Wave Theory, INTC is rallying in an impulsive waves structure since 2008 low and cycle is extending higher within the strongest 3rd wave. As presented on the Monthly chart, the stock is looking for the target area at $61.24 – $67.05 to end wave III followed by a pullback in wave IV then again the stock will resume the move higher.
INTC Elliott Wave Monthly Chart
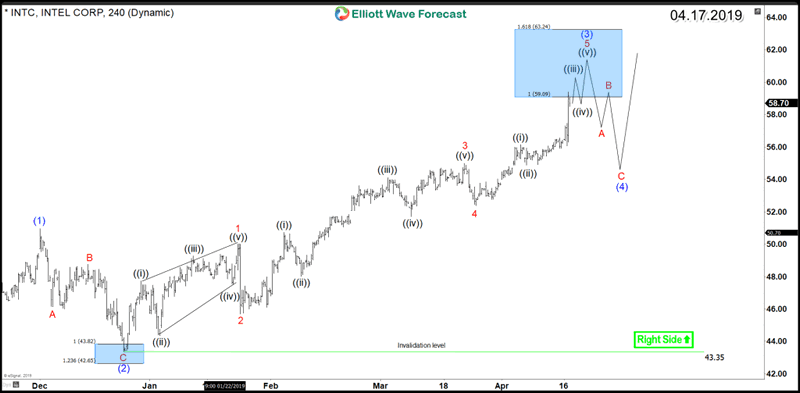
Consequently, the mid-term focus will be on the current cycle from October 2018 and December 2018 lows. INTC is already showing 5 waves up from $43.35 low and reached the minimum target area $59 – $63. Short term buyers needs to be careful at this stage as 3 waves pullback can be seen due to take profit.
A correction in wave (4) is expected to find buyers in 3, 7 or 11 swings as long as the pivot at December 2018 low remains intact for the stock to continue the rally higher as a 5 waves structure from October 2018 low.
INTC Elliott Wave 4H Chart
In conclusion, Intel Technical and Fundamental picture is strong in both sides and the stock is aiming for further gains in the future. Therefore Investors are advised to watch INTC closely for buying opportunity during the next Daily pullback.
By Ayoub Ben Rejeb
Get more insights about Stocks and ETFs by trying out our services 14 days . You’ll learn how to trade the market in the right side using the 3, 7 or 11 swings sequence. You will get access to our 78 instruments updated in 4 different time frames, Live Trading & Analysis Session done by our Expert Analysts every day, 24-hour chat room support and much more.
https://elliottwave-forecast.com
ElliottWave-Forecast has built its reputation on accurate technical analysis and a winning attitude. By successfully incorporating the Elliott Wave Theory with Market Correlation, Cycles, Proprietary Pivot System, we provide precise forecasts with up-to-date analysis for 52 instruments including Forex majors & crosses, Commodities and a number of Equity Indices from around the World. Our clients also have immediate access to our proprietary Actionable Trade Setups, Market Overview, 1 Hour, 4 Hour, Daily & Weekly Wave Counts. Weekend Webinar, Live Screen Sharing Sessions, Daily Technical Videos, Elliott Wave Setup .
Copyright © 2019 ElliottWave-Forecast - All Rights Reserved Disclaimer: The above is a matter of opinion provided for general information purposes only and is not intended as investment advice. Information and analysis above are derived from sources and utilising methods believed to be reliable, but we cannot accept responsibility for any losses you may incur as a result of this analysis. Individuals should consult with their personal financial advisors.
© 2005-2022 http://www.MarketOracle.co.uk - The Market Oracle is a FREE Daily Financial Markets Analysis & Forecasting online publication.