


HDFC Bank Elliott Wave Cycle from 2009 Getting Mature
Companies / Company Chart Analysis Apr 05, 2019 - 12:38 PM GMT

HDFC Bank Limited (Housing Development Finance Corporation) is an Indian banking and financial services company headquartered in Mumbai, India. It has 88,253 permanent employees as of 31 March 2018 and has a presence in Bharain, Hong Kong and Dubai. HDFC Bank is India’s largest private sector lender by assets. It is the largest bank in India by market capitalization as of February 2016. It was ranked 69th in 2016 BrandZ Top 100 Most Valuable Global Brands
HDFC Bank structure of the rally from the all time low is taking the form of an Elliott Wave Impulse and today, we will present the Long-term and mid-term Elliott Wave Analysis of HDFC Bank and also look at the upside targets after it broke above July 2018 peak (2220). HDFC Bank is part of NSE
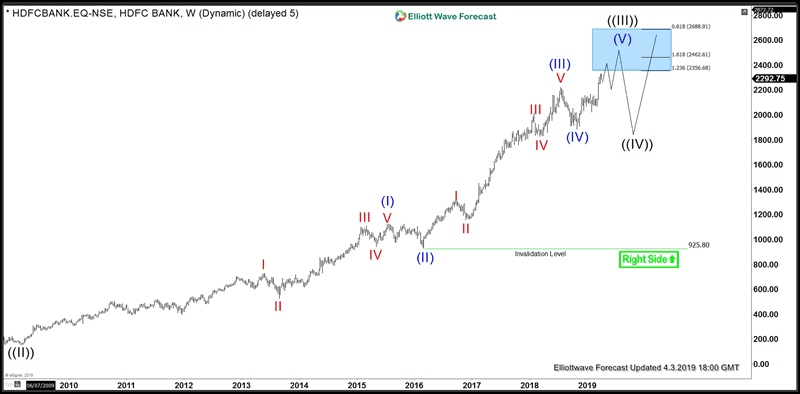
HDFC Bank Weekly Elliott Wave Analysis
Weekly chart shows HDFC Bank stock to be still within wave ((III)) from the all time low when wave (I) ended at 1128 (July 2015), wave (II) ended at 925.80 (February 2016), wave (III) ended at 2220 (July 2018) and wave (IV) completed at 1885 (October 2018). It has already made a new high above July 2018 peak suggesting wave (V) of ((III)) is in progress and should ideally reach an area between 2462 – 2688 to complete wave ((III)) before it starts a larger pull back in wave ((IV)) to correct the cycle from 2009 low and then resume the rally again. Trend is extreme as of now but there is still room for further upside within the cycle from January 2019 low and hence we don’t recommend the selling, short-term traders would still be looking for buying opportunities in intra-day dips. Mid-term traders, however, would ideally wait for a pull back in red wave IV and next swing trading opportunity would be seen during wave ((IV)) pull back.
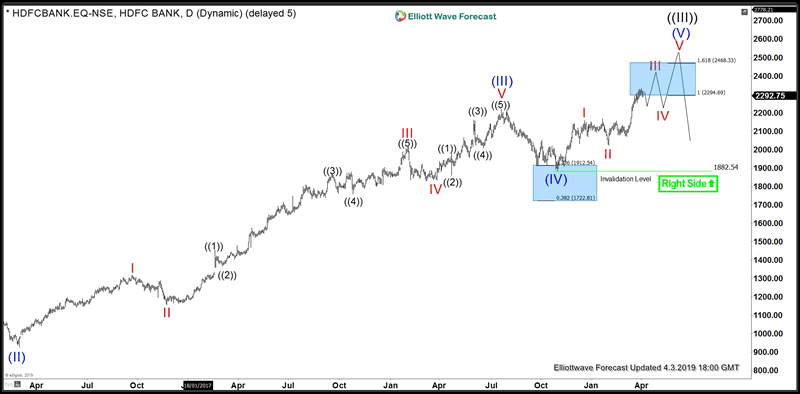
HDFC Bank Daily Elliott Wave Analysis
HDFC Bank Daily chart shows the structure of the move up from October 2018 low i.e. wave (IV) low. We can see that the stocks has reached 100% extension of wave I related to wave II but it appears to be still in 3 waves up from the red II low and is in need of a pull back and another high to complete red wave III. Afterwards, a pull back in wave IV would be expected to correct the cycle from 2022 (January 2019) low and another high to complete wave V of (V) and the black wave ((III)) which should mark the end of cycle from 2009 low and could then see a roll over process starting.
Alternatively, wave (V) could take the form of an Ending Diagonal when a pull back and another high would complete wave I of (V) as a zigzag and then we could see a larger pull back to correct the cycle from October 2018 low in the form of wave II before extension higher in the form of wave III of diagonal wave (V).
By Daud Bhatti
https://elliottwave-forecast.com
ElliottWave-Forecast has built its reputation on accurate technical analysis and a winning attitude. By successfully incorporating the Elliott Wave Theory with Market Correlation, Cycles, Proprietary Pivot System, we provide precise forecasts with up-to-date analysis for 52 instruments including Forex majors & crosses, Commodities and a number of Equity Indices from around the World. Our clients also have immediate access to our proprietary Actionable Trade Setups, Market Overview, 1 Hour, 4 Hour, Daily & Weekly Wave Counts. Weekend Webinar, Live Screen Sharing Sessions, Daily Technical Videos, Elliott Wave Setup .
Copyright © 2019 ElliottWave-Forecast - All Rights Reserved Disclaimer: The above is a matter of opinion provided for general information purposes only and is not intended as investment advice. Information and analysis above are derived from sources and utilising methods believed to be reliable, but we cannot accept responsibility for any losses you may incur as a result of this analysis. Individuals should consult with their personal financial advisors.
© 2005-2022 http://www.MarketOracle.co.uk - The Market Oracle is a FREE Daily Financial Markets Analysis & Forecasting online publication.