


The Fed Follows Trump's Tweets, And Does The Right Thing
Interest-Rates / US Interest Rates Mar 24, 2019 - 11:35 AM GMTBy: Steve_H_Hanke

 Earlier this week, the Fed left its target Fed funds rate unchanged at 2.25-2.50%. In addition, the Fed indicated that it had turned dovish. Rather than two Fed funds rate hikes in 2019, the Fed has now signaled that there will be none. And that’s not all. Starting in May, the Fed will reduce its balance sheet unwind of its Treasury holdings to $15 billion per month from $30 billion, and that it will end the unwind in September.
All this dovishness must have warmed the cockles of President Trump’s heart. For some time, Trump has been targeting the Fed with Twitter storms that have complained that the Fed has been too hawkish.
Well, the Fed apparently saw what the President saw. Or, maybe not. After all, one line of argument used to support the Fed’s new dovish stance is that the stance is necessary given the uncertainties that abound—both at home and abroad (read: regime uncertainties being created by President Trump himself).
In adopting its new dovish stance, the Fed has done the right thing. At least, that’s what the data show. Forget the President’s Tweets. Let’s run the analytics:
Did the Fed do the right thing? To answer that question, we must look at the money supply, broadly measured. Indeed, for me, a monetary approach to national income determination is what counts. The relationship between the growth rate of the money supply and nominal GDP is unambiguous and overwhelming. For example, just consider the U.S. from 2003 to 2018. The money supply (M4) grew at an annual rate of 3.59% and nominal GDP grew at a 3.62% annual rate.
So, what is the current U.S. monetary temperature? Let’s first determine the “golden growth” rate for the money supply, and then compare the actual growth rate of the money supply in the U.S. to the golden growth rate. To calculate the golden growth rate, I use the quantity theory of money (QTM). The income form of the QTM states: MV=Py, where M is the money supply, V is the velocity of money, P is the price level, and y is real GDP (national income).
Let’s use QTM to make some bench calculations to determine what the “golden growth” rate is for the money supply. This is the rate of broad money growth that would allow the Fed to hit its inflation target. I have calculated the golden growth rate from 2004 to the present.
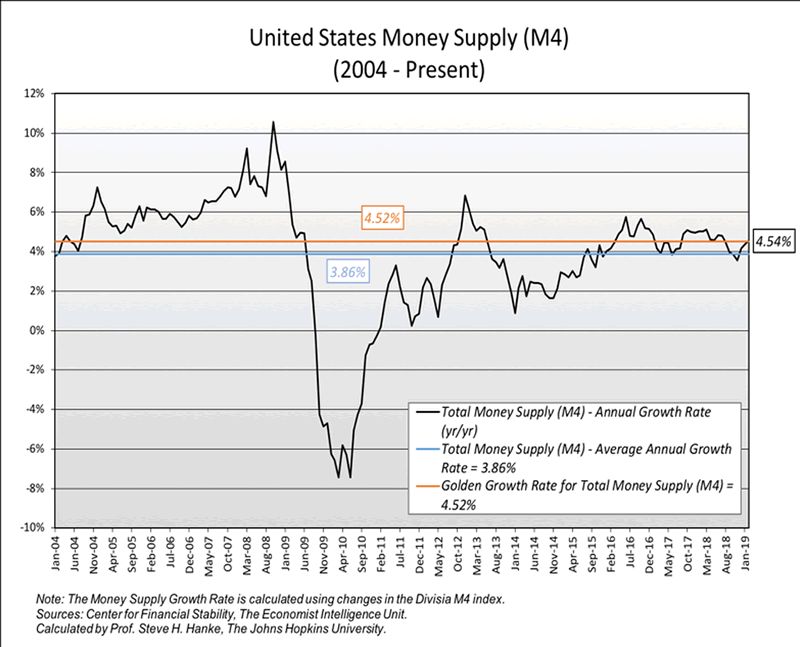
According to my calculations, the average percentage real GDP growth from January 2004 to the present was 1.91%, the average growth in Total Money Supply (M4) was 3.86%, and the average change in the velocity of money was -0.61%. Using these values and the Fed’s inflation target of 2.00%, I calculated the U.S. golden growth rate for Total Money (M4) to be 4.52%.
______
Calculations:
Golden Growth Rate = Inflation Target + Average Real GDP Growth – Average Percentage Change in Velocity.
U.S. Golden Growth Rate = 2.00%. + 1.91% - (-0.61%) = 4.52%
______
So, the growth rate of money supply (M4), which has been 3.86%, has lagged behind the golden growth rate of 4.52% (see my calculations and the chart below). This suggests that, on average, there has been tightness on the part of the Fed over the 2004-present period. But, at present, the growth rate of M4 is 4.54%/year, which is almost right on the golden growth rate of 4.52%/year.
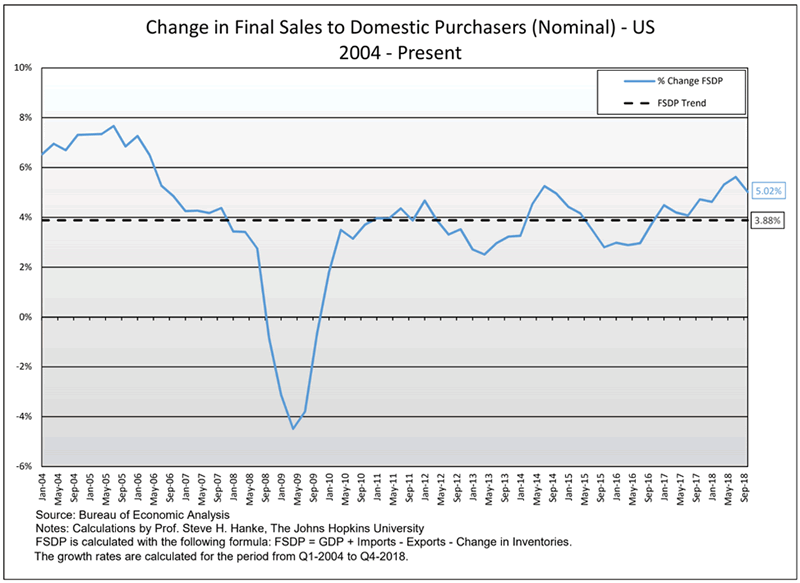
Not surprisingly, the current Fed monetary stance has produced a current growth rate in nominal aggregate demand measured by final sales to domestic purchasers of 5.02%/year, as shown in the chart below. So, the current money supply growth is very close to the golden growth rate, and aggregate demand is where we would expect it to be. Everything appears to be calm and in the “strike zone.”
So, why did the Fed turn dovish? It’s all about regime uncertainty. As it turns out, the Fed is watching President Trump, and it has determined he is a loose cannon—one that creates regime uncertainty. Indeed, the President’s unanticipated zigs and zags create a pervasive uncertainty in both the national and international economic scene. In consequence, the Fed has lowered its economic forecasts and has wisely decided to play it safe.
By Steve H. Hanke
www.cato.org/people/hanke.html
Twitter: @Steve_Hanke
Steve H. Hanke is a Professor of Applied Economics and Co-Director of the Institute for Applied Economics, Global Health, and the Study of Business Enterprise at The Johns Hopkins University in Baltimore. Prof. Hanke is also a Senior Fellow at the Cato Institute in Washington, D.C.; a Distinguished Professor at the Universitas Pelita Harapan in Jakarta, Indonesia; a Senior Advisor at the Renmin University of China’s International Monetary Research Institute in Beijing; a Special Counselor to the Center for Financial Stability in New York; a member of the National Bank of Kuwait’s International Advisory Board (chaired by Sir John Major); a member of the Financial Advisory Council of the United Arab Emirates; and a contributing editor at Globe Asia Magazine.
Copyright © 2019 Steve H. Hanke - All Rights Reserved
Disclaimer: The above is a matter of opinion provided for general information purposes only and is not intended as investment advice. Information and analysis above are derived from sources and utilising methods believed to be reliable, but we cannot accept responsibility for any losses you may incur as a result of this analysis. Individuals should consult with their personal financial advisors.
Steve H. Hanke Archive |
© 2005-2022 http://www.MarketOracle.co.uk - The Market Oracle is a FREE Daily Financial Markets Analysis & Forecasting online publication.