


The $TSX.CA Composite Index Cycles & Bullish Trend
Stock-Markets / Canada Mar 13, 2019 - 12:07 PM GMT

Firstly, the index has rallied with other world indices trending higher into the June 2008 highs. It then corrected the bullish cycle as did most other world indices. The index ended that larger degree correction in March 2009. It is at this point where the index corrected the whole all time up bullish cycle. Thus the March 2009 lows is from where this cycle and swing analysis will begin. It appears to be a new beginning.
Secondly, from the 2009 lows the index shows a 5 swing higher sequence that favors further upside. Price has reached and exceeded the 61.8 – 76.4 Fibonacci extension of the 2009 to 2011 bullish cycle. That happened in September 2014 under the red swing count. This area was also seen in the preferred blue count the 61.8-76.4 Fibonacci extension was reached and slightly exceeded in January 2018.
Thirdly, this Fibonacci extension on the chart below is measured as follows. Use a Fibonacci extension tool on a charting platform. Point 1 will be at the beginning of the cycle at the 2009 lows. From there on up to the 2011 highs will be point 2. The point 3 will be down at the 2011 lows. This put the swing higher to the 2014 highs in the aforementioned 61.8 – 76.4 Fibonacci extension of the 2009 to 2011 bullish cycle.
Fourthly this alone is not a usual place for the 3rd swing of a cycle to end as it is usually 100 to 1.236. The decline to the December 2016 lows was strong enough to suggest the index has corrected the whole cycle up from the 2009 lows. This, other than the bullish trend is why I prefer the swing count in blue.
The analysis & conclusion continues below the monthly chart.
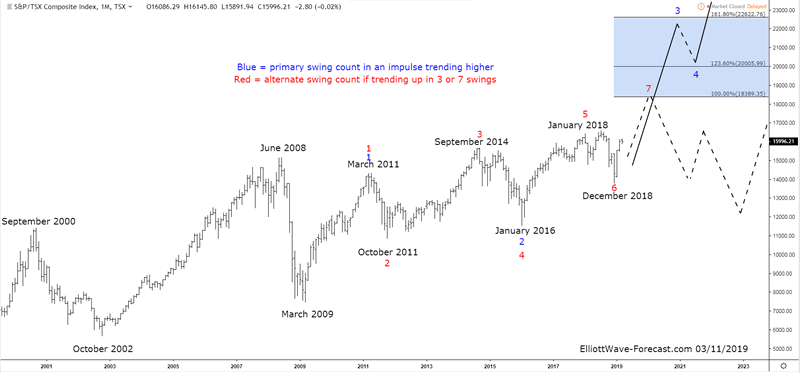
Lastly, using an earlier mentioned Fibonacci extension tool on a chart platform. The point 1 will be at the beginning of the cycle at the 2009 lows. From there on up to the 2011 highs will be point 2. The point 3 will be down at the 2016 lows. This is how the shown target area is derived. In most cases a fifth swing of a 7 swing move will end in this 61.8 – 76.4 Fibonacci extension area. The dip into the December 2018 lows suggested it was correcting the cycle from the 2016 lows.
In conclusion, while above the the December 2018 lows the index should trade higher in to either the red or blue swing count target area.
Thanks for looking. Feel free to come visit our website and check out our services Free for 14 days to see if we can be of help.
Kind regards & good luck trading.
Lewis Jones of the ElliottWave-Forecast.com Team
https://elliottwave-forecast.com
ElliottWave-Forecast has built its reputation on accurate technical analysis and a winning attitude. By successfully incorporating the Elliott Wave Theory with Market Correlation, Cycles, Proprietary Pivot System, we provide precise forecasts with up-to-date analysis for 52 instruments including Forex majors & crosses, Commodities and a number of Equity Indices from around the World. Our clients also have immediate access to our proprietary Actionable Trade Setups, Market Overview, 1 Hour, 4 Hour, Daily & Weekly Wave Counts. Weekend Webinar, Live Screen Sharing Sessions, Daily Technical Videos, Elliott Wave Setup .
Copyright © 2019 ElliottWave-Forecast - All Rights Reserved Disclaimer: The above is a matter of opinion provided for general information purposes only and is not intended as investment advice. Information and analysis above are derived from sources and utilising methods believed to be reliable, but we cannot accept responsibility for any losses you may incur as a result of this analysis. Individuals should consult with their personal financial advisors.
© 2005-2022 http://www.MarketOracle.co.uk - The Market Oracle is a FREE Daily Financial Markets Analysis & Forecasting online publication.