UK House Prices, Immigration, and Population Growth Mega Trend Forecast - Part1
Housing-Market / Immigration Mar 04, 2019 - 03:38 PM GMTBy: Nadeem_Walayat
 My latest analysis in a series aimed at arriving at a new multi-year trend forecast for UK house prices covers population growth which is one of the key primary drivers for UK house prices which since the Labour government of 1997 natural population growth net of births and deaths has been vastly supplemented by what has amounted to out of control immigration courtesy of Britain's membership of the European Union and the former Labour governments objective for the importation of millions of potential Labour voters from mostly new member states from across an impoverished eastern europe that resulted in near 5 million economic migrants settling in the UK by 2016, mostly in what were already over crowded British cities, thus putting severe pressure on services and infrastructure and the whole housing market as the likes of the rental sector soared with 1 million new buy to let landlords entering the market buying 4 million properties, forcing up house prices across the board where rents in large part are being funded by tax payers in the form of the soaring housing benefits bill.
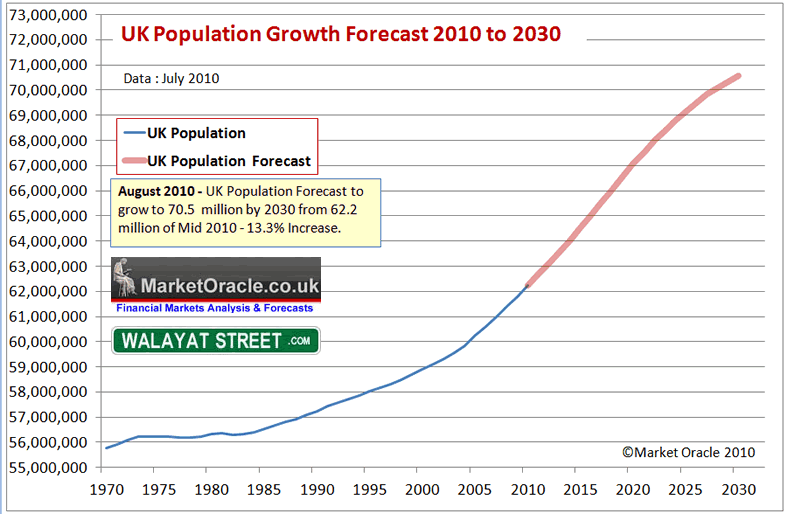
UK Population Growth Forecast 2010 to 2030
My long standing forecast is for the UK population to grow from 62.2 million as of Mid 2010 to at least 70.5 million by 2030 as excerpted below:
2nd August 2010 - UK Population Growth and Immigration Trend Forecast 2010 to 2030
The assumptions being factored into the UK population growth forecast are for a natural UK population growth rate of births exceeding deaths of 0.33% per year (current 200k), coupled with net average current immigration trend of 240k per year, supplemented with climate change refugees averaging 50k per year from 2015 onwards extrapolates into the following trend forecast over the next 10 years that targets a rise from 62.2 million as of mid 2010 to 67 million by mid 2020, and should the same trend be maintained beyond 2020 then the UK population could rise to above 72 million by mid 2030. However in all probability the country will not experience the post 2020 trend due to several converging factors including political pressures, capacity constraints and the UK's relegation in the economic prosperity leagues. Which implies a tapering off of net immigration in favour of natural growth which implies a lower total of nearer 70.5 million by 2030 as illustrated by the below graph.
One of the primary drivers for population growth an for triggering the EU Referendum is immigration, specifically EU immigration that many had concluded was out of control as membership of the European Union translates into the free movement of workers which has prevented the UK from controlling its borders for approaching 20 years now and has seen the UK buffeted by waves economic migrant flows from mostly Eastern Europe each year. All adding to those that came before with total immigration from the EU since 2000 having passed the 5 million mark by 2016. All whilst both Labour and then the Conservative governments promises to bring immigration under control having amounted to nothing more than empty promises, as parliament clearly has NO control over EU migration, which thus has continued well beyond the targets of tens of thousands per year.
And thus the people of Britain on the 23rd of June 2016 chose to take back control of Britain's borders by voting to LEAVE the European Union which followed over a decade of EU migration putting added pressure each year on housing, jobs and social services such as schools, NHS and the benefits system, virtually all of which were at critical breaking points.
Therefore this in-depth analysis takes a detailed look at immigration to determine what transpired, and where immigration is likely to trend over the coming years and its impact on all aspects of british life including on the housing market.
To best understand whether Britain actually has experienced an immigration crisis one needs to look at what the levels of immigration were BEFORE Tony Blair's Labour government came into power in 1997, soon opening up Britains' borders to migration from across eastern europe under the assumption that newly arrived migrants would tend to be more likely to vote Labour, the traditional political party for immigrants and thus seek to permanently improve the demographics in favour of the Labour party's electoral prospects.
Immigration 1970 to 1983 (14 years)
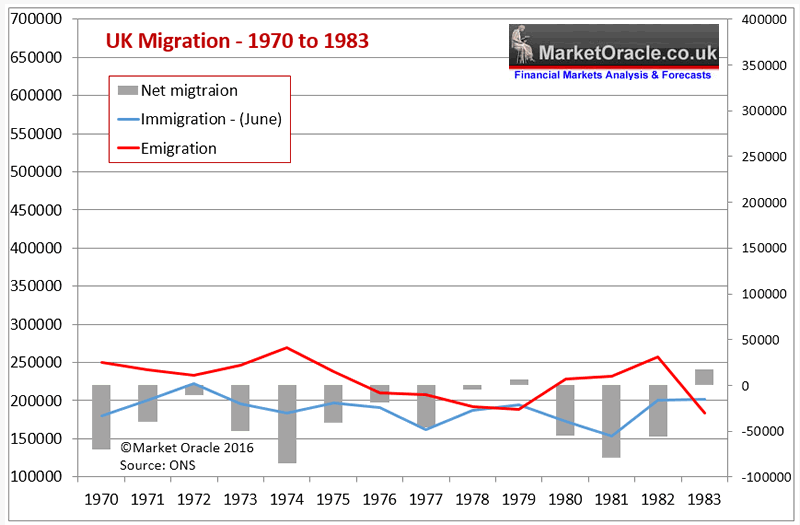
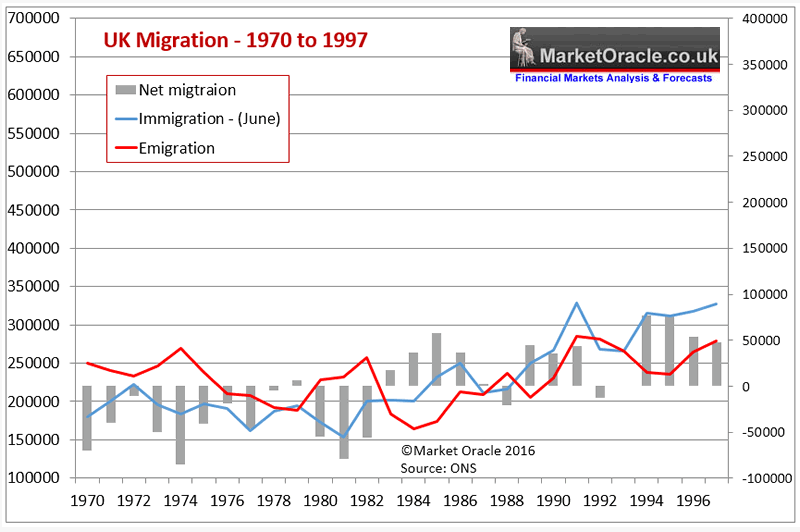
The key indicator to focus upon is net migration (grey bars) that show the difference between those emigrating and those immigrating into the UK, the fact is that between 1970 and 1983 the UK experienced net EMIGRATION i.e. more people LEFT the UK than ARRIVED for settlement.
| UK Immigration 1970-1983 | |
| Average annual Immigration | 188k |
| Average annual Emigration | 227k |
| Average Net Emigration | -38k |
The immigration facts of 1970 to 1983 are that on average 38,000 more people Emigrated from the UK than Immigrated into the UK each year. Whilst average annual Immigration was 188k against average annual emigration of 227k. Therefore the UK clearly did NOT have an immigration problem during this period instead the UK could be said to have had an Emigration problem, i.e. a brain drain as a consequence of high taxes and socialism such as heavily subsidised dieing industries such as steel, coal and the auto sector thus saw many millions of Brit's emigrate to former British colonies of America, Canada and Australia where the influx came to be known as the winging poms.
Immigration 1984 to 1997 (14 years)
| UK Migration 1984-1997 | |
| Average Immigration | 269k |
| Average Emigration | 234k |
| Average Net Migration | +34k |
For the next 14 years upto Labour taking power in 1997, average annual immigration was 269k against average annual emigration of 234k resulting an average net immigration of +34k. Therefore during the period upto Labour taking power in 1997 the UK did NOT have an immigration crisis or problem, with average net immigration at well below 50k per annum, and with the figure of 48k in the year Labour took office.
1998 to 2015
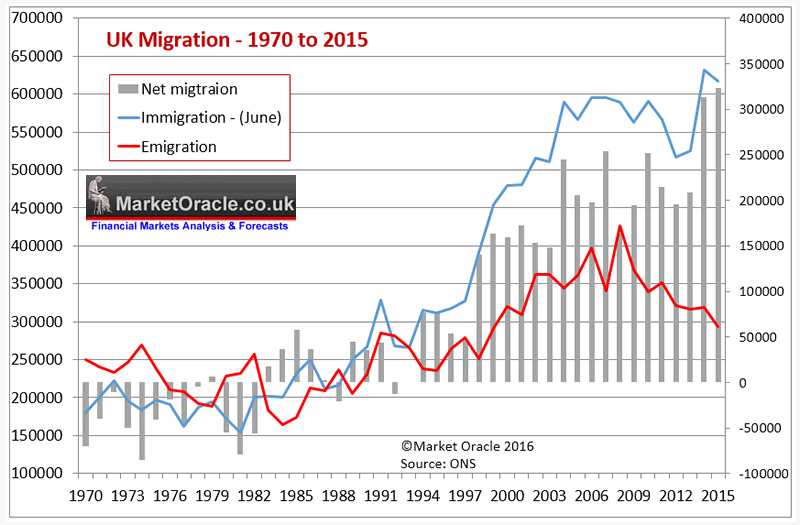
The labour years soon saw net migration first break above +100k per annum and then as free movement was opened up to the newly joined eastern europe nations, immigration soared by another +100k per annum averaging during the mid 2000's at 213k per annum, and only starting to dip slightly after Labour left office in 2010.
When David Cameron took power in 2010 he promised that he would cut net immigration by 2015 to the tens of thousands from the then disastrous annual figure of 205,000 - "Overall, net immigration would be kept in the tens of thousands, rather than the current rate of hundreds of thousands”. - David Cameron 2010
For the first 2 years of the Coalition it appeared that the government was on target to achieve its election pledge to some extent. However the trend soon sharply reversed as another set of impoverished eastern european states joined the EU such as Romania, Bulgaria and Czech and Slovakia were allowed free movement for work and benefits into the UK that sent immigration soaring into the stratosphere setting a new high of 323k for 2015.
| UK Migration 1998-2015 | |
| Average Immigration | 543k |
| Average Emigration | 377k |
| Average Net Migration | +206k |
UK net migration has been running at an average rate of +206k per annum against an average of +34k per annum during the preceding period (1984 to 1997), or at SIX TIMES the previous rate. However the last data in this series before the EU referendum of a net 323k is near NINE TIMES the preceding average that signals the extent to which Britain had lost control of its borders.
| Total Net Migration | |
| 1970- 1983 (14 years) | -533k |
| 1984- 1997 (14 years) | +480k |
| 1980- 1997 (18 years) | +308k |
| 1998 - 2015 (18 years) | +3.7 million |
The total net migration figures further illustrate that the 18 years in the lead up to the EU referendum had seen unprecedented and literally out of control immigration that resulted in a net 3.7 million net migrants, (total of 9.8 million) taking up residency in the UK which compares against just 308k during the preceding 18 years (1980 - 1997). Or at TEN TIMES the previous rate. So, yes, Britain most definitely DID have an immigration crisis in the lead up to the EU referendum as net migration was accelerating to a new extreme level of 323k which implied that if urgent action was not taken then the UK could look forward to far higher net migration over the next decade, i.e. to at least DOUBLE the average rate of the preceding 18 years of 206k per annum. However an establishment heavily invested in high immigration of low paid workers completely missed its significance in terms of the impact it would have on the outcome of the 2016 EU Referendum that the establishment had convinced they would win right upto the close of polls on the 23rd of June 2016 as my following video illustrates:
Latest ONS Migration Statistics and Consequences
The rest of this analysis will continues Part2, which has first being made available to Patrons who support my work. https://www.patreon.com/posts/uk-house-prices-24096020
To get immediate access right now and First Access to ALL of my future analysis and trend forecasts then do consider becoming a Patron by supporting my work for just $3 per month. https://www.patreon.com/Nadeem_Walayat
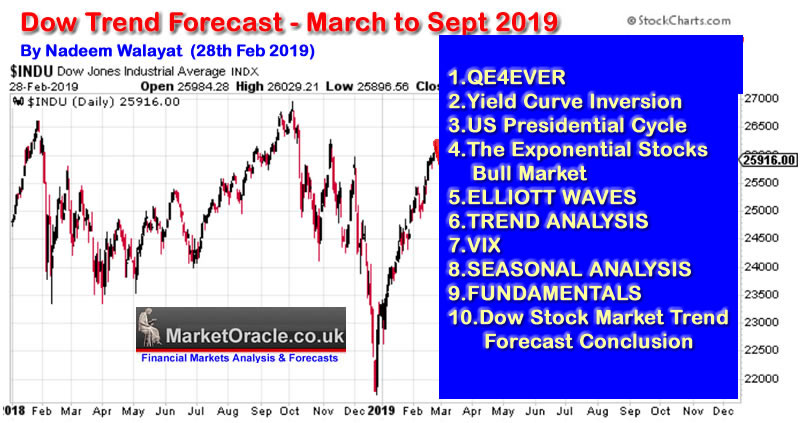
Whilst my latest analysis concludes in a 6 month trend forecast for Stock Market from March to September 2019:
Your analyst,
Nadeem Walayat
Copyright © 2005-2019 Marketoracle.co.uk (Market Oracle Ltd). All rights reserved.
Nadeem Walayat has over 30 years experience of trading derivatives, portfolio management and analysing the financial markets, including one of few who both anticipated and Beat the 1987 Crash. Nadeem's forward looking analysis focuses on UK inflation, economy, interest rates and housing market. He is the author of five ebook's in the The Inflation Mega-Trend and Stocks Stealth Bull Market series that can be downloaded for Free.
 Nadeem is the Editor of The Market Oracle, a FREE Daily Financial Markets Analysis & Forecasting online publication that presents in-depth analysis from over 1000 experienced analysts on a range of views of the probable direction of the financial markets, thus enabling our readers to arrive at an informed opinion on future market direction. http://www.marketoracle.co.uk
Disclaimer: The above is a matter of opinion provided for general information purposes only and is not intended as investment advice. Information and analysis above are derived from sources and utilising methods believed to be reliable, but we cannot accept responsibility for any trading losses you may incur as a result of this analysis. Individuals should consult with their personal financial advisors before engaging in any trading activities.
Nadeem Walayat Archive |
© 2005-2022 http://www.MarketOracle.co.uk - The Market Oracle is a FREE Daily Financial Markets Analysis & Forecasting online publication.


