


Yield Curve Inversion and the Stock Market 2019
Stock-Markets / Inverted Yield Curve Mar 03, 2019 - 06:13 PM GMTBy: Nadeem_Walayat

Yield Curve Inversion
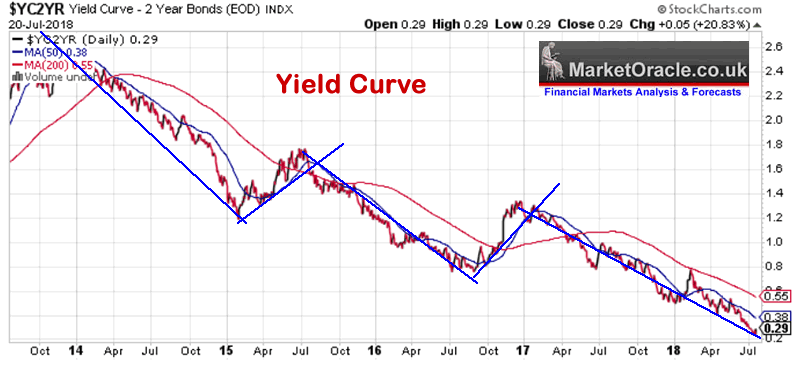
An inverted yield curve is basically when the yield on 2 year US government bond exceeds the 10 year US bond yield as worried investors opt to disinvest from risky assets in favour of safer longer term government bonds thus driving down long bond yields below that of nearer term bonds. And the closer the yield curve gets towards towards an inversion the greater the likelihood for a future recession. So far the yield curve inversion has successfully forecast the last 3 economic downturns in the United States. Though the YCI has proved less reliable elsewhere, especially for Australia.
My last in depth look at stocks (July 2018) included expectations for the yield curve to invert by the end of 2018, which implied a risk of a recession during the second half of 2019.
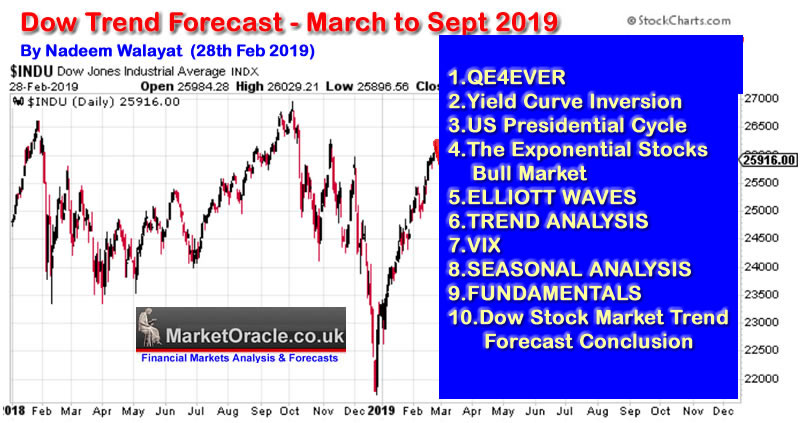
This is the second in a series of articles that concludes in a detailed trend forecast for the Stock Market Dow Stocks Index covering the period from March 2019 to September 2019.
- Fed Balance Sheey - QE4EVER
- Yield Curve Inversion
- US Presidential Cycle
- The Exponential Stocks Bull Market
- ELLIOTT WAVES
- TREND ANALYSIS
- VIX
- SEASONAL ANALYSIS
- FUNDAMENTALS
- Dow Stock Market Trend Forecast Conclusion
However, the whole of this analysis has first been made available to Patrons who support my work.
So for immediate First Access to ALL of my analysis and trend forecasts then do consider becoming a Patron by supporting my work for just $3 per month. https://www.patreon.com/Nadeem_Walayat.
Yield Curve Trend
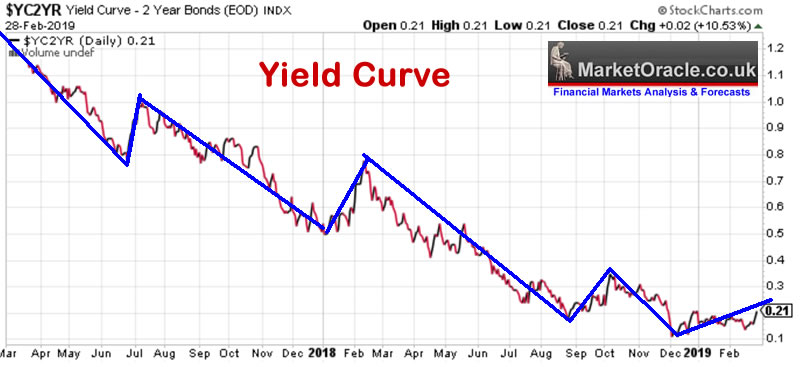
The spread between the 2 year and 10 year US bonds narrowed to a low of 0.11 in December but avoided an inversion, subsequent to which the Yield curve has stabilised in a trading range of between 0.14 and 0.20 that could be a sign for a base building TREND CHANGE that helped sow the seeds for our current stocks rally as the stock market has been increasingly discounting a LESS likelihood for a recession.
So as things stand today, the yield curve is signaling weaker economic growth but NOT a recession during 2019, which compared to the trend trajectory we were on going into December is strongly positive for stocks. Of course the Yield curve could weaken once more by targeting a break of the low of 0.11. Which should be a good ADVANCE signal for stock market weakness. But until then the signal from the Yield curve is positive for stocks for 2019.
However, it should be noted that we are living in an era of QE4EVER, which means that just because a yield curve inversion signaled a recession in the past, that does NOT mean it will happen next time due to the impact of Fed money printing debt monetization. So even if the yield curve inverts, one needs to keep things in perspective and not take any signal indicator too seriously.
The whole of this analysis has first been made available to Patrons who support my work.
So for immediate First Access to ALL of my analysis and trend forecasts then do consider becoming a Patron by supporting my work for just $3 per month. https://www.patreon.com/Nadeem_Walayat.
Your Analyst
Nadeem Walayat
Copyright © 2005-2019 Marketoracle.co.uk (Market Oracle Ltd). All rights reserved.
Nadeem Walayat has over 30 years experience of trading derivatives, portfolio management and analysing the financial markets, including one of few who both anticipated and Beat the 1987 Crash. Nadeem's forward looking analysis focuses on UK inflation, economy, interest rates and housing market. He is the author of five ebook's in the The Inflation Mega-Trend and Stocks Stealth Bull Market series that can be downloaded for Free.


 Nadeem is the Editor of The Market Oracle, a FREE Daily Financial Markets Analysis & Forecasting online publication that presents in-depth analysis from over 1000 experienced analysts on a range of views of the probable direction of the financial markets, thus enabling our readers to arrive at an informed opinion on future market direction. http://www.marketoracle.co.uk
Disclaimer: The above is a matter of opinion provided for general information purposes only and is not intended as investment advice. Information and analysis above are derived from sources and utilising methods believed to be reliable, but we cannot accept responsibility for any trading losses you may incur as a result of this analysis. Individuals should consult with their personal financial advisors before engaging in any trading activities.
Nadeem Walayat Archive |
© 2005-2022 http://www.MarketOracle.co.uk - The Market Oracle is a FREE Daily Financial Markets Analysis & Forecasting online publication.