


A Bounceback for the Mid-cap Energy Sector?
Companies / Oil Companies Sep 23, 2008 - 10:40 AM GMTBy: Evan_Smith

 In the first half of 2008, mid-cap energy stocks significantly outperformed their large-cap counterparts as investors prized the faster production growth found in many of the mid-cap names.
The trend line fell off abruptly at the beginning of July, when market sentiment for energy and other commodities underwent a dramatic change. Distressed hedge funds and other investors have scrambled for cash in the third quarter, and to get that cash, they have sold the best-performing stocks of the first half of the year -- energy stocks, and more specifically, mid-cap energy stocks that are challenged to absorb the selling pressure.
This has put considerable pressure on the higher growth mid-cap energy stocks this quarter as seen in the chart below. The S&P 400 Energy Index was down more than 40 percent in mid-September, compared to the negative 24 percent performance for the large-cap energy stocks.
The 9.4 percent gain in the S&P 400 Energy Index on September 19 suggests that we may be on the verge of a meaningful rally. This key energy benchmark is now roughly 13 percent above the 52-week low set on September 9.
Additionally, crude oil has climbed back above $100 a barrel after hitting an intraday low of $90 earlier in the week. We are beginning to see positive technical signs for energy stocks and their underlying commodities, which could bode well in the intermediate term.
Quarter-to-date performance of Large Cap and Mid-Cap Energy stocks
Source: Bloomberg
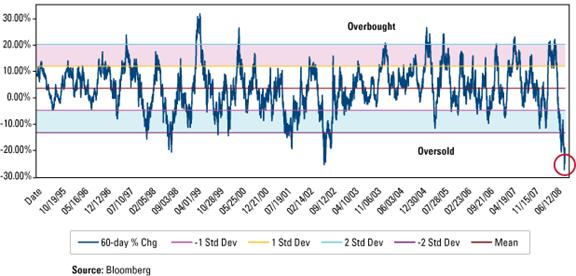
The decline in energy equities in the third quarter led to the most oversold conditions in the 13-year history of the S&P 1500 Energy Index, which includes large-, mid- and small-cap energy stocks and is considered the broadest measure of the sector.
You can see that in the lower right corner of the oscillator chart below, which measures the index's rate of change relative to its long-term mean over a rolling 60-trading-day period. Statistically, a rise or a drop of more than two standard deviations means the chances of a reversal toward the mean are more than 95 percent.
To put the current fear and panic into context, the index has plunged deeper into oversold territory than during the crude oil price collapse of 1998 and the stock market capitulation in the summer of 2002, when the market bottomed out and then began a five-year bull market.
S&P 1500 Energy Index Oscillator
Also corresponding to this tumble in the index is a decline in the price of West Texas Intermediate crude oil from a peak of $145 per barrel in mid-July to near $90 per barrel last week, which was the first close under $100 per barrel in six months.
Before energy equities can resume a sustainable upward trajectory, the crude oil price needs to stabilize. Using recent history as a guide, we may be at or near that stabilization point.
The 37 percent decline in crude oil over the past two months is one of the worst corrections in the past decade, significantly surpassed only by the 52 percent decline that began in December 1998. That decline was triggered by the implosion of the Long-Term Capital Management hedge fund and the currency collapse in Russia , then the world's second-largest oil producer.
When the selling pressure is over, we believe the mid-cap energy stocks can rebound quickly and substantially .
By Evan Smith, CFA
Evan Smith, CFA, is co-manager of U.S. Global Investors , a Texas-based investment adviser that specializes in natural resources, emerging markets and global infrastructure. The company's 13 mutual funds include the Global Resources Fund (PSPFX) , Gold and Precious Metals Fund (USERX) and Global MegaTrends Fund (MEGAX) .
More timely commentary from Frank Holmes is available in his investment blog, “Frank Talk”: www.usfunds.com/franktalk .
Please consider carefully the fund's investment objectives, risks, charges and expenses. For this and other important information, obtain a fund prospectus by visiting www.usfunds.com or by calling 1-800-US-FUNDS (1-800-873-8637). Read it carefully before investing. Distributed by U.S. Global Brokerage, Inc.
All opinions expressed and data provided are subject to change without notice. Some of these opinions may not be appropriate to every investor. Gold funds may be susceptible to adverse economic, political or regulatory developments due to concentrating in a single theme. The price of gold is subject to substantial price fluctuations over short periods of time and may be affected by unpredicted international monetary and political policies. We suggest investing no more than 5% to 10% of your portfolio in gold or gold stocks. The following securities mentioned in the article were held by one or more of U.S. Global Investors family of funds as of 12-31-07 : streetTRACKS Gold Trust.
Evan Smith Archive |
© 2005-2022 http://www.MarketOracle.co.uk - The Market Oracle is a FREE Daily Financial Markets Analysis & Forecasting online publication.