Plunging Inventories have Zinc Bulls Ready to Run
Commodities / Metals & Mining Feb 15, 2019 - 06:22 PM GMTBy: Richard_Mills
 On Tuesday zinc inventories in London Metal Exchange (LME) warehouses sunk into territory that one metal analyst believes could signal a major price kick for the base metal, used mostly for galvanizing steel to prevent corrosion.
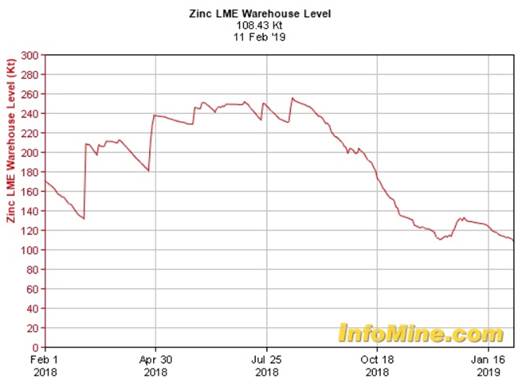
The one-year chart below shows LME inventories falling steadily, touching the 108,425-tonne mark as of Feb. 11 - a 52-week low. It’s a long way from the annual high of 256,175 tonnes reached in August.
Cormark Securities mining analyst Stefan Ioannou said last fall that if zinc supply drops 2,000 to 3,000 tonnes a day it would be a very bullish price signal, especially if inventories go as low as 100,000 tonnes. The one-week chart shows zinc inventories dropping from 112,750 tonnes on Feb. 5 to 108,500t on Feb 11 - a fall of 4,250 tonnes, and within only 8,000 tonnes of Ioannou’s100,000t target zone.
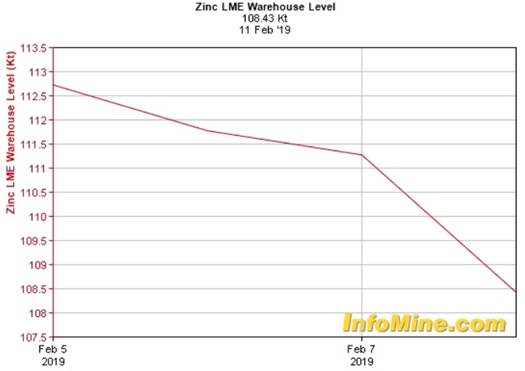
“I think things get really interesting if you see LME approach 100,000 tonnes. At that point we’re talking about world supply — when you add in the other entities — being somewhere under a week of global demand, so things get ‘critical,’ and at that point I think you can see zinc prices spike quite quickly.” - Cormark Securities mining analyst Stefan Ioannou
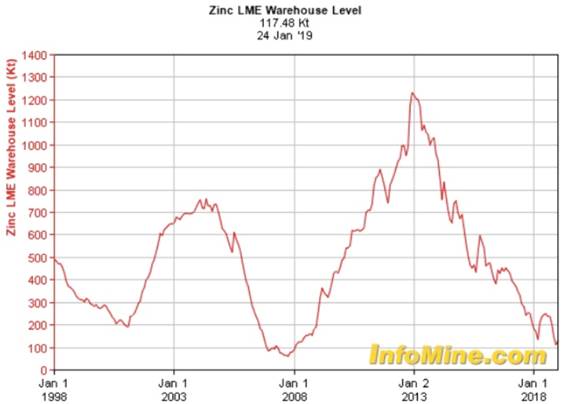
Could we be looking at another run in the zinc price like in 2017, when it spiked from $1.19 a pound to $1.61 within only six months (+35%)? Recall zinc had the hot hand that year, with many juniors roaming around with boots on the ground trying to find the next zinc deposit, with the price getting a nice uplift from mine closures and an expected long-term structural supply deficit.
The majority of the world’s zinc deposits contain lead, meaning lead and zinc are mined together. Sphalerite is zinc’s main ore and is usually associated with galena, the lead mineral, and chalcopyrite, the copper mineral.
Zinc and lead mineralization generally occur together, within limestone, in veins associated with granitoids, and as volcanogenic massive sulfide (VMS) deposits. The latter can also contain precious metals.
It makes sense then, if we’re looking at zinc, that we also analyze what is happening with lead. It turns out that the outlook for silver, like zinc, is also promising this year, after several years of ho-hum performance.
The Silver Institute expects silver prices to climb 7% this year on the back of increasing industrial, jewelry and investment demand, versus reduced supply.
Read on. This article is all about the VMS metals zinc, lead and silver.
Zinc
As mentioned, zinc had a banner year in 2017, climbing about 38% (between 2016 and 2018 zinc rocketed 132%) but the base metal had a reality check in 2018. Despite falling inventories squeezing supply, US-China trade war worries weighed heavily on the entire base metals complex including zinc, which tanked around 24%.
The year started off well reaching $1.63 a pound in February, but once US President Trump began threatening China with billions in tariffs, then following through, base metals investors ran scared. The galvanized sheet trade, for example, was hit with 25% steel tariffs.
Despite trade war headwinds, however, zinc’s fundamentals are solid. Stefan Ioannou, the Cormark mining analyst, sees zinc demand perking along at 2-3%. Some very large zinc mines have been depleted and shut down in recent years, with not enough new mine supply to take their place.
MMG’s shuttered Century mine for example used to supply 4% of the world’s zinc. Between the shutdown of the Lisheen mine in Ireland, Century, and Glencore’s Brunswick and Perseverance mines in Canada, over a million tonnes was ripped from global zinc production.
The closed mines represent an estimated 10 to 15% of the zinc market. On the flip side, there have been few discoveries or big zinc projects planned. This is setting the zinc market up for a supply shortage.
The International Lead and Zinc Study Group predicts the zinc market will be in a deficit position of 72,000 tonnes in 2019.
BMI Research noted in June 2018 that refiners, particularly in China, will have a hard time securing zinc concentrate, due to zinc mine production curtailments in 2015-16 (eg. Rampura Aguchain India, Antamin and Iscaycruz in Peru as well as by Glencore and Nyrstar), along with the aforementioned mine closures. For example tightened environmental standards to deal with choking air pollution meant that Zijin Mining cut 8.2% of its zinc production in 2017.
Chinese smelters rely heavily on imported zinc ore. In 2017 China’s refined zinc production was at its lowest in two years due to problems acquiring zinc concentrate.
The supply squeeze is also trickling down to junior zinc explorers. When zinc prices were low, exploration dried up, meaning there’s not enough supply to match the growing demand for zinc especially for galvanized steel, Jeff Hussey, president and CEO of Osisko Metals, recently told Kitco News:
“The world needs more zinc mines but we don’t have them because there has been no exploration. If you had all the expected development projects come on line at full capacity, analysts expect that demand will still outstrip supply by mid-2020,” he said. “This means there is a limited risks of further downside in the price long term.”
Consider that two of the largest new zinc mines will not produce enough ore to make up for all of the recent closures and output cuts. While New Century is restarting its zinc mine that closed in 2016 - at the time the world’s third largest - “it will take time for Century to ramp up and longer still for that flow of raw material to make a significant impact on the refined metal section of the supply chain,” according to Reuters metals columnist Andy Home, who believes the zinc market has entered a period of peak tightness.
Australia’s Dugald River mine, opened in 2017, and Vedanta Zinc’s Gamberg mine in South Africa, commissioned last July - can between them only produce a combined 420,000 tonnes of zinc concentrate, less than 3% of global demand.
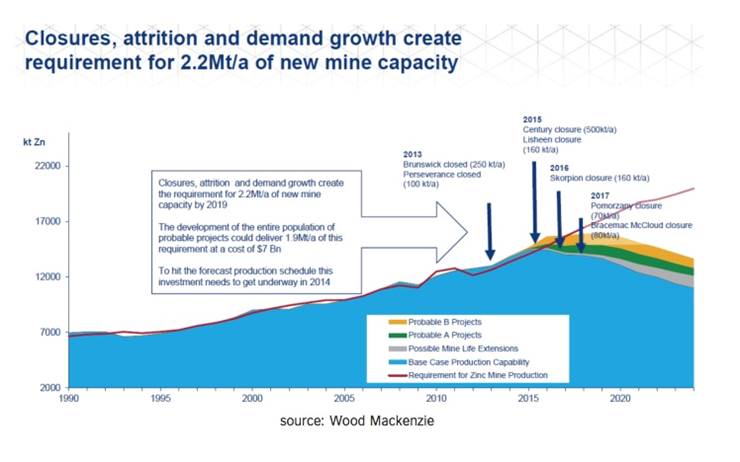
Wood Mackenzie states that zinc mine closures, attrition and demand growth will require 2.2 million tonnes of new mine capacity a year.
Speaking of zinc demand, it’s not going away. Despite zinc’s low profile among investors, it is the fourth most mined metal. While its primary use is to stop steel from rusting, other applications are shoring up demand. Adding zinc to fertilizer increases soil productivity, and there is research being conducted to develop a nickel-zinc battery for use in electric vehicles. Zinc, of course, is already used in alkaline batteries.
Zinc is also used heavily in infrastructure build-outs. This includes desperately needed bridges, public buildings, power stations, dams etc. in the US, much of the developing world, and China’s Belt and Road Initiative which along with needing billions of tonnes of copper, is going to require a lot of steel containing zinc.
Zinc alloys including brass are used in corrosion-resistant marine components and musical instruments, to name a couple of more applications.
According to the US Geological Survey, in 2018 the top zinc-producing countries were China, Peru, India and Australia. In terms of reserves, Australia has the most zinc at 64 million tonnes, second is China at 41Mt, and Peru is in third place at 28Mt, of the world’s identified zinc resources of 1.9 billion tonnes.
Lead
Like copper and zinc, lead was also pulled into the trade war vortex that had base metals flailing for most of 2018. Lead started the year at $1.15 a pound but had sunk to under 90 cents by year-end. The underperformance of several key lead mines was made up for by supplying the market with previously held stocks of the metal.

For the first three-quarters of the year, world refined lead demand outstripped supply by 110,000 tonnes, notes the International Lead and Zinc Study Group.
Out of 2 billion tonnes of world lead resources, the top lead depository is Australia, with 35 million tonnes of reserves, then China and Russia, closely followed by Peru. The leading producer in 2017 was China (2.4Mt), with Australia (450,000t) a distant second.
One of the earliest metals known to humans, lead was used by the Romans to make water pipes and for lining baths. It was also applied to ship hulls and was later employed for roofing and construction due to its fire- and water-resistant qualities.
The most common application of lead nowadays is for automobile batteries. By the early 2000s, 88% of US demand for lead was in lead-acid batteries. Lead is also used in ammunition, sailboat ballast, in vests to shield patients from X-rays, as soldering material, a coloring pigment, in aviation fuel, sheathing power cables, roofing, semiconductors, and as a coolant for certain nuclear reactors.
Silver
The last member of our VMS triad is silver, also known as “the devil’s metal” for its volatility.
Silver is usually paired with gold in the precious metals complex (gold, silver, platinum, palladium) because of the historical and geological relationship between the two. The ratio of gold to silver in the Earth’s crust is 17:1.
During the Roman Empire the ratio of gold to silver was 12:1 and in 18th century United States, it was 15:1 meaning that one troy ounce of gold was worth 15 ounces of silver.
The average ratio over the past 20 years has been 60:1. Why is that important? Because the gold to silver ratio is a tried and true trading signal that can tell an investor when to buy the devil’s metal. Historically, when the ratio is high, it’s been during times of economic uncertainty or recession. Currently the ratio is 83:1, but in September, when all hell was breaking loose in the stock markets, it was up over 85. The last time the ratio was that high was in 1991 - the all-time high - at the depths of a recession. Anything above 80 means two things: a recession is likely coming, and that silver is undervalued compared to gold. For more on this read here.
Silver analyst David Morgan says that now is the cheapest he’s seen silver, adjusted for inflation, since he started in the business 20 years ago, when it was $5 an ounce. Morgan said in an interview if gold rises above $1,350 an ounce, he’s “absolutely convinced” silver will follow.
Compared to a poor 2018, with silver losing about $3 an ounce from $17 to $14, due primarily to a high US dollar and rising interest rates, the precious metal has moved up nicely. Over the past two months, the silver price has gained 7%.
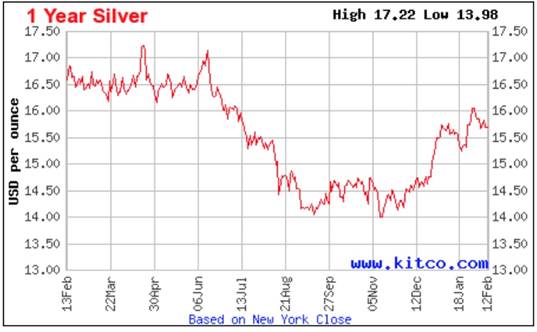
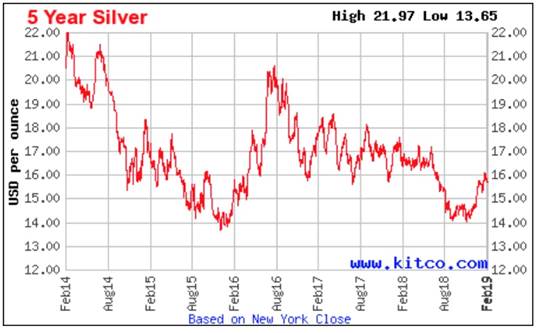
According to the Silver Institute (SI), it’s not just the gold-silver ratio that is pumping up silver. The slowdown in Federal Reserve rate hiking is also expected to help. It’s also about market dynamics. The institute notes 2019 is projected to be the third year in a row that all of the silver produced is taken up by either the industrial or investment markets for it.
The bullishness is backed by 12% more American Eagle silver coins sold in January 2019 compared to January 2018; SI expects a 5% bump in physical silver investment demand this year, pointing to Europe and India as key buyers.
The precious metal's industrial uses should continue to grow this year, states SI, including demand for electronics and solar panels, along with jewelry and ETFs which are projected to add 8 million ounces. The Silver Institute cites Thailand as a growing market for silver jewelry, and India for overall silver demand, noting silver imports last year were 220% higher in India than in 2017 – a total of 225 million ounces.
Meawhile, mined silver production is expected to drop 2% this year, says SI – setting up a demand-supply imbalance that should support higher prices.
Most of the world’s silver is mined in Mexico, 5,600 tons in 2017, followed by Peru at 4,500t. The latter also has the most reserves at 93,000t followed, rather surprisingly, by Poland and Australia, each at 89,000t.
According to the USGS, although silver was the main product at several mines, it was primarily obtained as a by-product from lead-zinc mines, copper mines and gold mines, in that order. Polymetallic ore deposits account for over two-thirds of US and world silver resources.
Conclusion
After a year of pain for all three metals we’ve discussed here - zinc, lead and silver - it looks like 2019 is going to see a turnaround. The setup for a zinc supply shortage has been several years coming. Despite a couple of new mines recently coming onstream, we are seeing drastically depleted LME inventories of zinc. As zinc in storage keeps falling, expect the price to correct.
Wood Mackenzie thinks that mine closures, attrition and demand growth will require 2.2 million tonnes of new mine capacity a year. That’s good news for exploration companies that are staking fresh ground and hoping to develop the next big zinc deposit, likely also containing lead and silver.
The devil’s metal is also poised to run in 2019. Bullish signals are present in terms of the 80+ gold to silver ratio, the likely cessation of interest rate hikes and even a move towards lowerrates, if the US economy continues to underperform, plus all the demand factors outlined by the Silver Institute.
I’ve got polymetallic (zinc-lead-silver) deposits on my radar right now and a very exciting VMS junior that I will soon introduce to my readers.
By Richard (Rick) Mills
If you're interested in learning more about the junior resource and bio-med sectors please come and visit us at www.aheadoftheherd.com
Site membership is free. No credit card or personal information is asked for.
Richard is host of Aheadoftheherd.com and invests in the junior resource sector.
His articles have been published on over 400 websites, including: Wall Street Journal, Market Oracle, USAToday, National Post, Stockhouse, Lewrockwell, Pinnacledigest, Uranium Miner, Beforeitsnews, SeekingAlpha, MontrealGazette, Casey Research, 24hgold, Vancouver Sun, CBSnews, SilverBearCafe, Infomine, Huffington Post, Mineweb, 321Gold, Kitco, Gold-Eagle, The Gold/Energy Reports, Calgary Herald, Resource Investor, Mining.com, Forbes, FNArena, Uraniumseek, Financial Sense, Goldseek, Dallasnews, Vantagewire, Resourceclips and the Association of Mining Analysts.
Copyright © 2019 Richard (Rick) Mills - All Rights Reserved
Legal Notice / Disclaimer: This document is not and should not be construed as an offer to sell or the solicitation of an offer to purchase or subscribe for any investment. Richard Mills has based this document on information obtained from sources he believes to be reliable but which has not been independently verified; Richard Mills makes no guarantee, representation or warranty and accepts no responsibility or liability as to its accuracy or completeness. Expressions of opinion are those of Richard Mills only and are subject to change without notice. Richard Mills assumes no warranty, liability or guarantee for the current relevance, correctness or completeness of any information provided within this Report and will not be held liable for the consequence of reliance upon any opinion or statement contained herein or any omission. Furthermore, I, Richard Mills, assume no liability for any direct or indirect loss or damage or, in particular, for lost profit, which you may incur as a result of the use and existence of the information provided within this Report.
© 2005-2022 http://www.MarketOracle.co.uk - The Market Oracle is a FREE Daily Financial Markets Analysis & Forecasting online publication.


