


EURO Crisis Set to Intensify: US Dollar Breakout Higher
Currencies / Euro Feb 11, 2019 - 06:51 AM GMTBy: FXCOT

 Major U.S. indexes have crossed or are nearing their 200-day moving averages and the number of stocks setting 52-week highs is on the rise, among other indicators favored by portfolio managers and investment gurus trying to divine the market’s next move. The rally is widely seen as resulting from a more cautious rate-increase outlook from the Federal Reserve and continuing faith in the U.S. economy. But those factors haven’t quelled concerns about U.S.-China trade tensions and a potential slowdown in corporate earnings that would spell trouble for the nearly decade-old bull market.
The SPX after breaking down into the end of 2018 has now regained poise. The rally of the lows has been broad based as shown below.
SPX: Right at the resistance
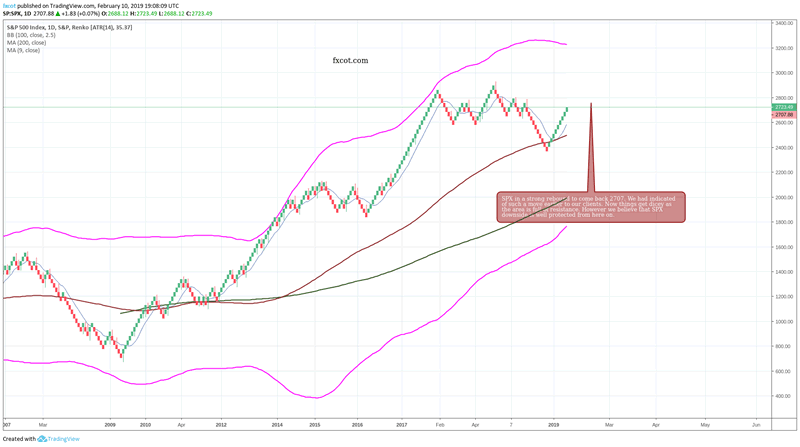
The downside is well protected here. Our initial thesis was a move to 2730 which has nearly been achieved. We are comfortable in suggesting that while the upside may be limited from here on, we do not recommend shorting the index as of now. There is far too much momentum and push behind the rebound here to make it difficult to judge if it will rollover. We need to wait for evidence of a failure at 2730 before we can consider shorting. For all we know, we could be at the cusp of a new bull run which can take us to 3200, as unlikely as it sounds but stranger things have happened.
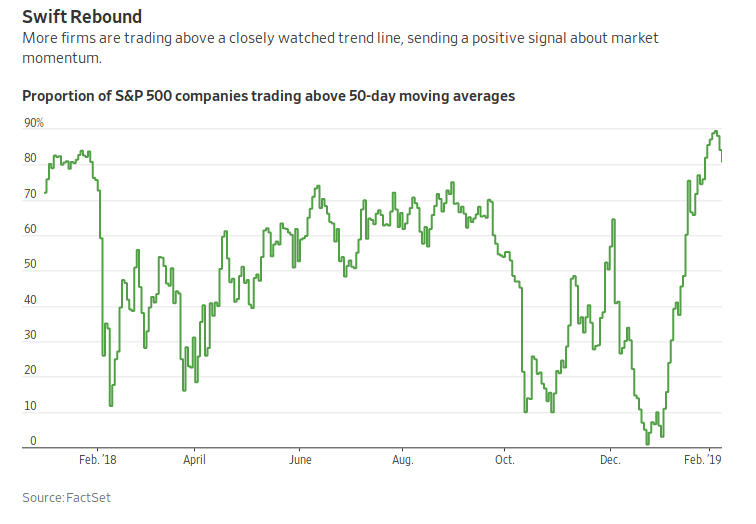
More than 80% of the companies in the index are now trading above their 50-day moving averages, up from less than 1% on Christmas Eve.
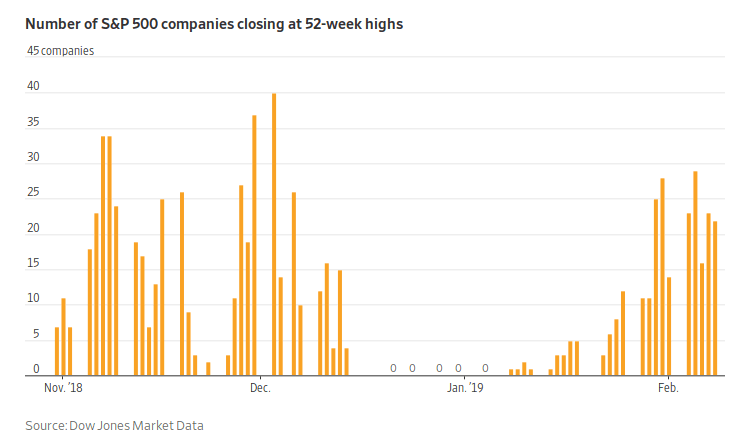
And many S&P 500 companies have hit new 52-week highs of late, after the index went 14 days through Jan. 7 without any such moves, the longest period since May 2009. On Friday, 22 firms in the S&P 500 set 52-week highs.
One reason this year’s rally has been so broad is that positive market signals have reinforced rebounding indicators tied to the U.S. economy. The gap between short- and long-term Treasury yields, known as the yield curve, has stabilized, signaling investors are less concerned about U.S. growth. That in turn has boosted shares of banks, which borrow on short time frames and loan over longer terms.
The KBW Nasdaq Bank Index has risen 12% this year, lifted by Citigroup Inc. with a 19% jump and Bank of America Corp. , which is up 15%. And the rebound in oil prices—U.S. crude has climbed 16% in 2019—has spurred a similar rebound in energy stocks, while indicating investor fears of a lingering supply glut have eased.
In Europe, German economy is facing headwinds which could intensify the crisis. The retail sales have plummeted, Inflation has started to slip again, Business climate indicators have fallen while political upheaval in france has still not been brought under control.
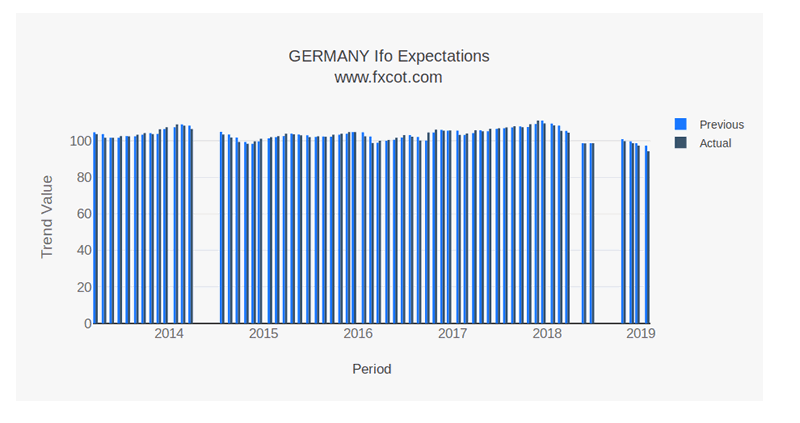
The ifo business climate indication point to weakness ahead.
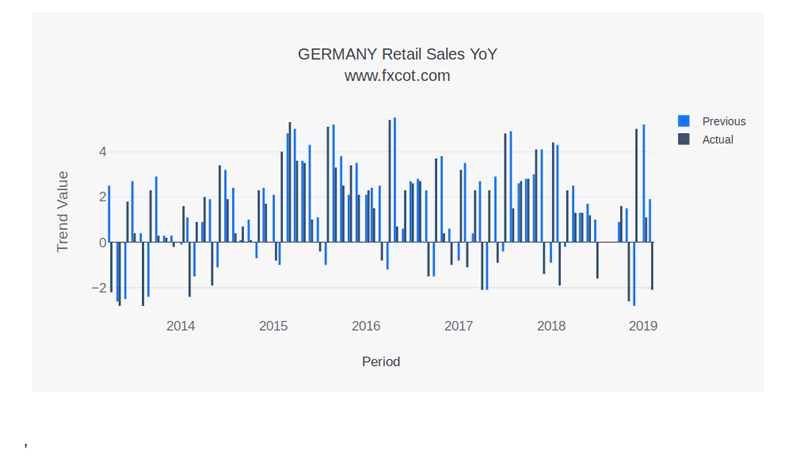
The retail sales have fallen by over 2% last month. While retail sales is not a big chunk of the economy, but it does point us to weakness in consumption pattern.
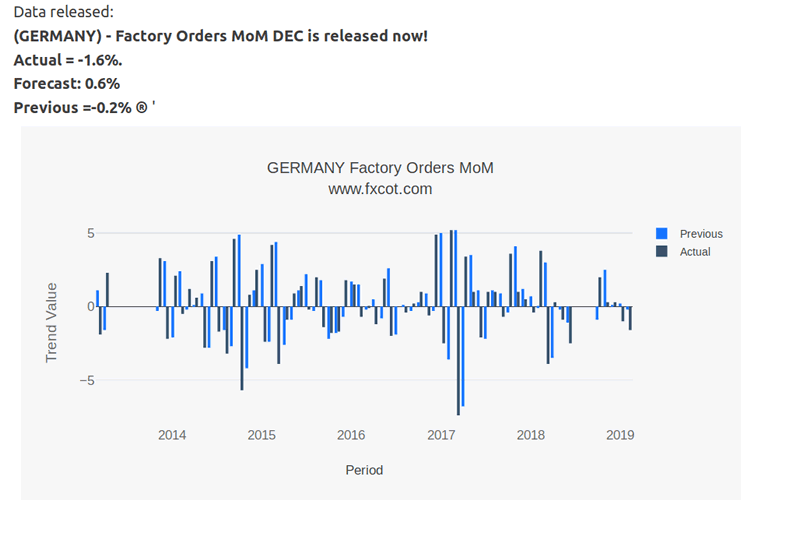
The factory orders have plummeted in Germany by -1.6%.
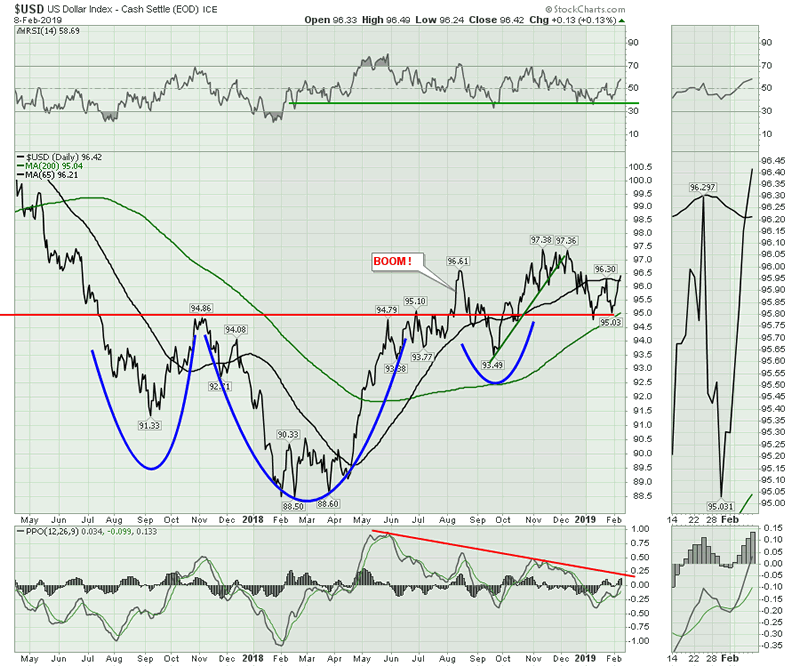
Dollar Index: Significant Bullish move coming

While the German economy stutters, the USD could attract capital from all over the world as higher yields and buzzing economy compared to european economies will push USD higher. The index has pushed above a key level at 96.4.
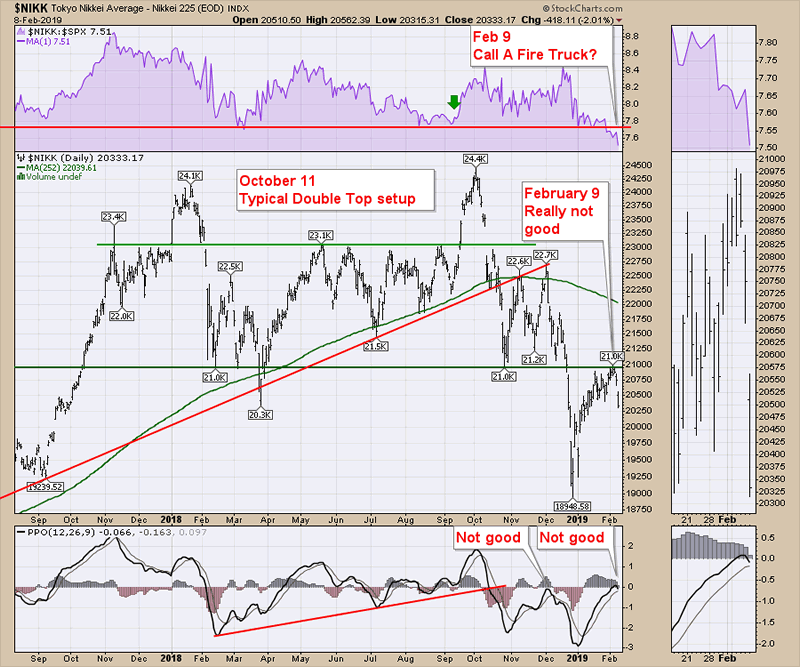
The Nikkei has been struggling the overhead resistance. It is wait and watch but the downside again looks limited here.
Sweedish Krona : Moves before the EURO.
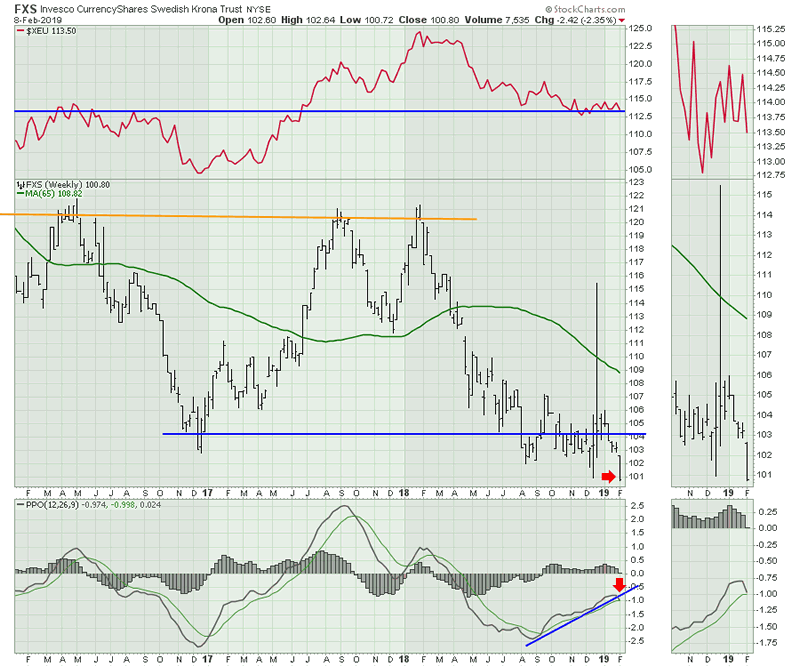
General understanding among traders is that the sweedish currency moves before the EUR by a week or two. The chart then is showing us that the EUR is set to crack below the support at 1.13. Clearly in the above we see the sweedish crona breaking below the support area and is headed lower. This is predictive of the coming move in EURUSD down to 1.08 from 1.1330 currently.
EURUSD: Is set to fall to 1.08 in coming weeks.
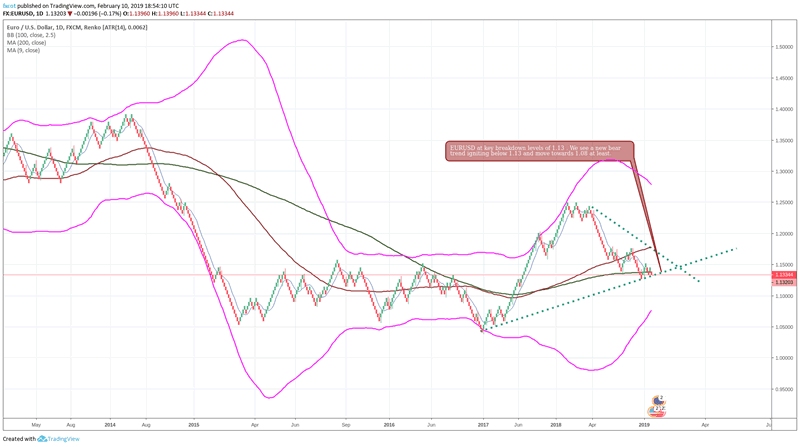
The daily charts above show the breaking of support at 1.1330 and then the next support at 1.1290 being under focus next week. EURUSD weekly charts
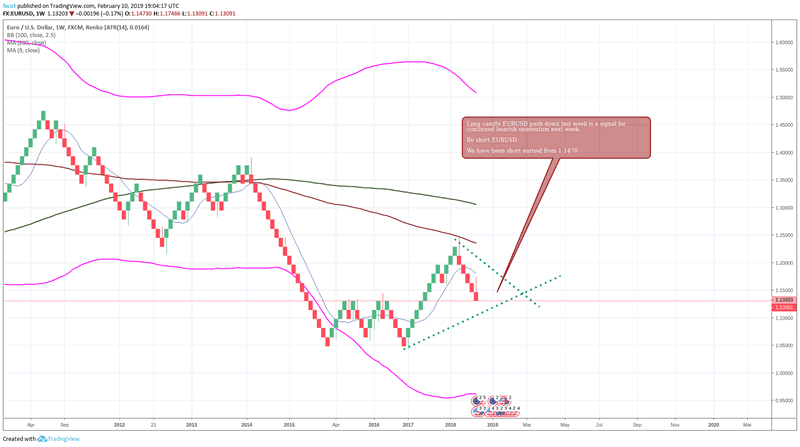
The weekly charts show the powerful long handle hammer. This is suggestive of a continued push down in coming week.
We share live trade setups on forex markets and run a high performance trade copier service for our clients. Our analysis is to the point helping clients make money instead of getting caught in a lot of head knowledge.
We also run an automated trading system which has been performing very well. The trading system we run has had a stellar run since 2010 and continues to be right on the money since we started offering it to clients from November 2018. Those who want to trial out the system, please reach out to us at Contact Us
Teamcot
FXCOT is Investment Management firm specializing in futures and forex trading. We run a high return trading system for our premier clients. The trading systems uses four different strategies to take advantage of various market conditions. We also send daily trade setups and economic commentary.
© 2019 Copyright FXCOT - All Rights Reserved Disclaimer: The above is a matter of opinion provided for general information purposes only and is not intended as investment advice. Information and analysis above are derived from sources and utilising methods believed to be reliable, but we cannot accept responsibility for any losses you may incur as a result of this analysis. Individuals should consult with their personal financial advisors.
© 2005-2022 http://www.MarketOracle.co.uk - The Market Oracle is a FREE Daily Financial Markets Analysis & Forecasting online publication.