


Our Tech Stock Market Prediction – PART II
Stock-Markets / Tech Stocks Feb 10, 2019 - 05:59 PM GMTBy: Chris_Vermeulen

If you missed PART 1 (SP500 Price Forecast) be sure to read it here.
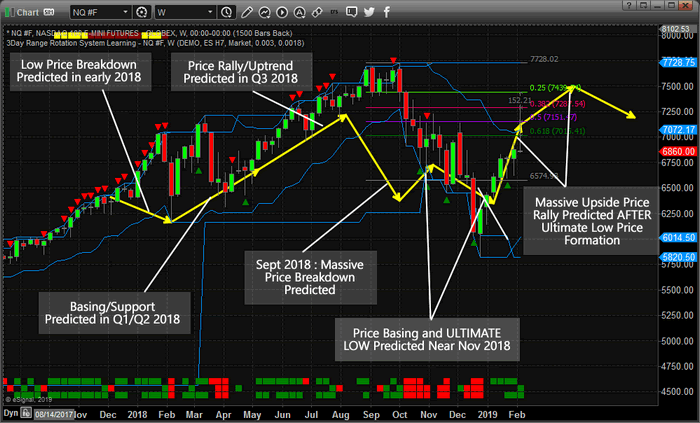
Here is PART II let’s take a look at the NQ Weekly chart with the ADL predictive price modeling.
We are going to include predictions made by our Adaptive Dynamic Learning (ADL) price modeling system that originated from December 2017 going all the way forward through to the end of May 2019.
At this point, we are going to highlight our earlier predictions (all of 2018 and into Q1/Q2 of 2019) and show you what the market has done since these calls were made back in September 2018. Pay attention to this weekly chart and pay attention to the YELLOW ARROWS on this chart. We have highlighted key predictive price modeling points with these yellow arrows on the chart to show you what our ADL predictive modeling system suggested would happen back in December 2017.
Now, take a look at the NQ Weekly chart with the ADL predictive price modeling results displayed onto it. Pay attention to the similarities in the price patterns and the rotational modeling differences between the two charts. The ES ADL modeling predictions from “Part I” are similar to this NQ chart, but the differences really tell us about how the technology-heavy NASDAQ (NQ) will react in a different manner than the Blue-Chip heavy ES.
Also, pay attention to the right side of this chart where the ADL predictive modeling system is suggesting price weakness will roll into the NQ near May 2018 and how this may become an issue for some traders.
Remember, the differences between these two charts really show you where strengths and weakness apply to the different sectors of the US stock market. One sector may be trending upward while another sector may see weakness. All of this plays into how we find and see opportunities for our members and decide on trading opportunities for success.
Think about how powerful this predictive price modeling system really is to be able to call this market moves 10~20+ months in advance. Certainly, it is not perfect in every prediction, but the advanced knowledge and resources it provides is has proven to be a powerful tool for insight into future price direction.
It is not too often that we share this level of research with the general public. We issued the September 2018 research post because we wanted to warn our followers that a massive price decline/rotation was about to unfold. You can read all of our free research posts. Today, we are sharing with you our ADL predictive price modeling results for the next 3~4 months for the NQ – how valuable is that? If you save or print this article, you will be able to reference it going forward for the next 90+ days and compare the real price action to our ADL predictive modeling results. We believe the results will be similar to what our ADL is suggesting and we can see these ADL results for any instrument traded throughout the world.
We believe 2019 will be an incredible year for skilled traders and we believe the markets will set up numerous trade setups for fantastic profits. We are already hard at work developing new member tools, research models and algo trading systems to help our members take advantage of these incredible market moves. Please take a minute to see how our researchers and traders at www.TheTechnicalTraders.com can assist you this year. We will be launching an incredible new member tool in about 30~60 days. You won’t want to miss this fantastic new software utility to help you find and execute great trades. See you in the member’s section of our site.
Chris Vermeulen
www.TheTechnicalTraders.com
Chris Vermeulen has been involved in the markets since 1997 and is the founder of Technical Traders Ltd. He is an internationally recognized technical analyst, trader, and is the author of the book: 7 Steps to Win With Logic
Through years of research, trading and helping individual traders around the world. He learned that many traders have great trading ideas, but they lack one thing, they struggle to execute trades in a systematic way for consistent results. Chris helps educate traders with a three-hour video course that can change your trading results for the better.
His mission is to help his clients boost their trading performance while reducing market exposure and portfolio volatility.
He is a regular speaker on HoweStreet.com, and the FinancialSurvivorNetwork radio shows. Chris was also featured on the cover of AmalgaTrader Magazine, and contributes articles to several leading financial hubs like MarketOracle.co.uk
Disclaimer: Nothing in this report should be construed as a solicitation to buy or sell any securities mentioned. Technical Traders Ltd., its owners and the author of this report are not registered broker-dealers or financial advisors. Before investing in any securities, you should consult with your financial advisor and a registered broker-dealer. Never make an investment based solely on what you read in an online or printed report, including this report, especially if the investment involves a small, thinly-traded company that isn’t well known. Technical Traders Ltd. and the author of this report has been paid by Cardiff Energy Corp. In addition, the author owns shares of Cardiff Energy Corp. and would also benefit from volume and price appreciation of its stock. The information provided here within should not be construed as a financial analysis but rather as an advertisement. The author’s views and opinions regarding the companies featured in reports are his own views and are based on information that he has researched independently and has received, which the author assumes to be reliable. Technical Traders Ltd. and the author of this report do not guarantee the accuracy, completeness, or usefulness of any content of this report, nor its fitness for any particular purpose. Lastly, the author does not guarantee that any of the companies mentioned in the reports will perform as expected, and any comparisons made to other companies may not be valid or come into effect.
Chris Vermeulen Archive |
© 2005-2022 http://www.MarketOracle.co.uk - The Market Oracle is a FREE Daily Financial Markets Analysis & Forecasting online publication.