A Dangerous and Deceptive Gold Market
Commodities / Gold & Silver Sep 23, 2008 - 08:19 AM GMTBy: Brian_Bloom
 For some months, this analyst has been urging readers to focus more on capital preservation than on capital growth. This is not as simple a concept as it seems.
For example, it is “obvious” – to those who have no faith in the US economy and/or the US Dollar – that gold is one place where the prudent investor should be invested.
I agree with this logic for the following reasons:
• Gold represents an insurance policy in which up to (say) 10% of one's assets should be invested.
• Gold represents a fundamentally sound long term investment – because of its unique physical properties.
Having said this, I disagree with the argument that gold will, one day, again be the generally accepted currency of last resort.
We can argue about this until our eyes cross, but I don't think it will matter who is right in the long term. If we are all long term holders of gold and if we all agree that gold has a long term upside, then let's not get bogged down in disagreement as to the reasons why the gold price will likely rise.
However, the reasons for gold's long term upside potential do become important if one has a short to medium term view. If I happen to be correct that gold's long term upside potential is unrelated to its notional status as “the currency of last resort”, then gold could have more downside volatility than many people would be comfortable to endure. Of course, if I happen to be wrong then gold will have more upside volatility than I am expecting. Yes, as long term holders, it makes no difference. Unfortunately, if you are a trader, it will very possibly make a big difference.
A friend recently sent me a fascinating article – which really caught my attention when I read it – because it demonstrates what I know from personal experience to be true, which is that “ignorance” does not equate to “stupidity”.
By contrast, those who are highly educated often behave stupidly because, armed with education, one tends to have answers in search of questions. We who are knowledgeable about world financial affairs just “know” that gold is the obvious fall back position – so we stop thinking about it; and we stop listening to contrary arguments. That is potentially very dangerous.
The article which my friend sent me referred to a town called Totnes in the UK – which has created its own currency. (See: http://transitionculture.org )
Readers who are prepared to exercise their minds are urged to mull over the implications of this seemingly bizarre development – perhaps over a warm stout. It is not a trivial development in this analyst's view; and Totnes is now not the only town trading with its own currency. There are now one hundred so-called “transitional towns” in England . (See: http://www.bloomberg.com/apps/ )
You see, when someone doesn't know that what they are attempting to achieve can't be done, then they just go ahead and do it – and, wouldn't you know it? They get it to work. Well, gosh darn! Who woulda thunk?
What the good folk of Totnes did is they just opted out of the UK 's financial system – to the extent that it affected trade between themselves – and they just went ahead and created their own currency out of thin air. The key determinant of success, of course, was a willingness to abide by some self imposed rules. And when you are prepared to do that, then you can use anything you like as the backing for your currency. The issues devolve to “trust” and “mutual respect”. In this particular case, the backing to the Totnes Pound is paper. Ah yes, the paper happens to be British Pounds – but it didn't have to be. The good people of the town of Lewes are investigating an alternative option. You see, they don't know that it's impossible. And, not to be outdone, the good people of Totnes are now contemplating the possibility that they may create their own energy and use that as a backing for the Totnes pound. Go figure.
Here's a direct and relevant quote from the second article:
“In 1932, the Austrian town of Worgl introduced an emergency local currency as money shortages and unemployment ravaged the national economy. A year later, unemployment had fallen by 25 percent in the town while other areas continued to suffer, according to a translated and abridged version of ``The Experiment in Worgl'' by Fritz Schwarz.”
Okay, so if you are now mellow from your pint of Guinness and your mind is receptive to possibilities, then it may just be possible that the gold price – in the short term – doesn't “have” to rise. The simple truth is that whether or not it rises in the short term will be a function of technical forces in the market place. No more and no less.
Now the reader should understand that I have no axe to grind. I am a long term holder of gold shares (as opposed to gold) and I don't care about short term movements. I am therefore able to look at the charts of gold and be as objective as it is possible to be. Of course, that doesn't mean that I will read them correctly. But it does mean that I'm not looking for reasons to justify my prejudicial viewpoint that the gold price will either rise or fall.
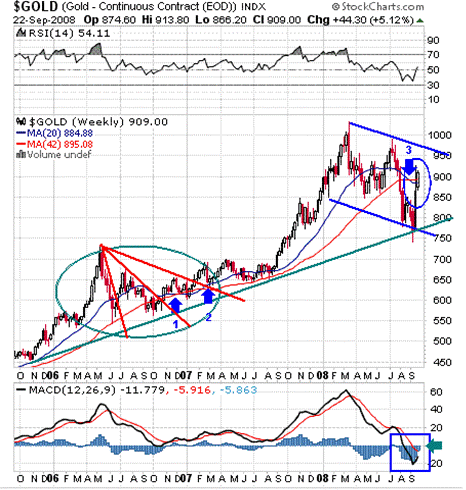
So let's look at the following weekly chart of the gold price – courtesy stockcharts.com

The first point of interest emerges from the arrows marked “1” and “2”.
At arrow # 1, the 20 week MA line crossed below the 42 week MA line – thereby giving a sell signal. This sell signal was aborted when the 20 week MA crossed back up above the 42 week MA at arrow #2.
Of interest, there had previously emerged a bullish “fan” formation in the price chart and, prior to arrow #2, the price had broken up above the third (red) fan line – thereby giving a serious buy signal. Thereafter, the price pulled back in a textbook reaction and bounced back up from the support of the third fan line.
The reader's attention is now drawn to arrow #3. This marks the point at which a sell signal was given when the 20 week MA crossed (again) below the 42 week MA. Whilst this was accompanied by a serious fall in the gold price, it was followed by an equally serious upward bounce – and the question now arises as to whether the 20 week MA will turn up and cross above the 42 week MA for a second time.
Should it do so, then the MACD histograms – which are highlighted by the turquoise arrow at the bottom of the chart – will likely break above the zero resistance line.
But – and here's the thing – the last time the MACD histograms tried to do this, they failed, and the histograms went back into negative territory. Also, when we look at the period between arrow #1 and arrow #2 we note that the histograms had actually been travelling in positive territory prior to the breakup at arrow #2. This is not the case now.
From a bullish perspective, it can be argued that, just as the fan formation was a bullish formation, so what we are looking at now is a flag formation – which is typically a pause within a Primary Trend.
That argument is absolutely correct. Further, by drawing in the lower of the two parallel lines, the strong support at $775 manifested. That, essentially, was why the gold price catapulted up when it bounced off the double support of the rising turquoise trend line and the falling blue lower flag line.
Arguably – also from a bull's perspective – the Relative Strength Indicator (the oscillator at the top of the chart) had bounced up from an extraordinarily low level. Now at the 50% level, it is in no mans land and could break either way, but (a bull's) logic dictates that it would be more natural if the oscillator followed through to an overbought position before it turned down again.
But then that gives rise to an interesting observation. This particular chart dates back to October 2005 and, since October 2005 the RSI has never gotten close to the 30% level – until a few weeks ago.
Yes, that might have been caused by “manipulation”, as some gold bulls are arguing. But it might have been caused by stale speculative bulls bailing out to raise cash when the world's financial markets started to go into a tailspin. That would have been “normal” market forces at work.
Interim Conclusion
The turquoise rising (intermediate term) trend line remains inviolate, and the gold price remains in its medium term uptrend – which is what most gold bulls would expect. But, arguably, because most gold bulls were expecting this, that is what made it so. Buyers came into the market in a rush when the price reached the trend line. The world is full of technical traders.
Unfortunately, the technical evidence is less cut and dried than is comfortable. Right now, the flag formation is the only really compelling technical argument in favour of the turquoise line remaining intact.
By now the readers eyes are glazed. Why is he going on about this? Isn't it all just a bit academic?
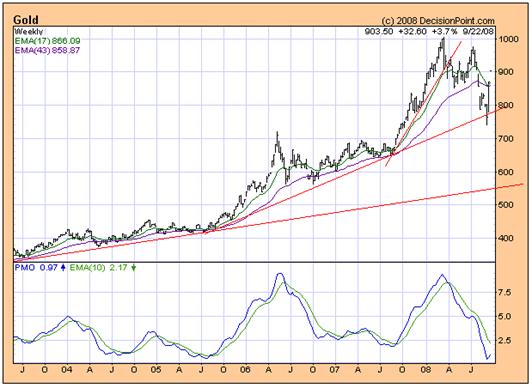
The answer is: “Not really”, because the method of construction of the weekly stockchart.com chart seems to be different from that of the Decisionpoint.com chart below. It appears that Decisionpoint charts Monday to Friday on its weekly charts and, because of this, their weekly chart of the gold price shows some gaps which are mot evident on the stockcharts.com chart.

Gaps are very important little indicators in the world of technical analysis. They evidence the presence of a highly charged emotional environment. As such, most tend to be covered in time as the price moves to reverse direction and cover the gap.
That is precisely what has happened during the last upsurge. All the downside gaps - even the first one that manifested six weeks ago – have now been covered.
Aha! But, unfortunately, in covering the very first downside gap, the most recent movement in the gold price caused an upside gap to manifest. In time, this gap also needs to be covered.
The problem is, that if the gold price does pull back to cover the most recent gap, it will have to pull back to a level of around $870 an ounce. In so doing, it will fall below a steeply rising trend line (not shown, but nevertheless relevant) and it will also bring the price back to a point which will challenge the support of the now falling Moving Average lines.
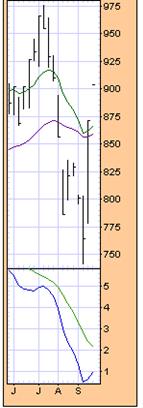
 Well, not really falling, but very close. Let's have a look at a close up
In truth they are both showing an uptick. But the question is this: If the price pulls back to cover the gap at around $875, will it penetrate below the MA's? If it does (which is quite possible in the larger context) will it cause the green line to cross over through the purple line? If that happens, then the rising turquoise line in the first chart may be penetrated on the downside – in which case the gold price could fall all the way back to the $550 - $600 an ounce level and STILL be in a Primary Bull Trend.
(As an aside, the reader will note that the relative positions of the Decisionpoint MAs are subtly different from those in the stockcharts.com chart. This is because I have chosen a 20 week and 42 week MA for the stockcharts.com chart, and decisionpoint.com uses 17 weeks and 43 week MAs).
“Impossible!” I hear you shout. “The price will bounce up off the Moving Average lines. Its bleeding obvious that the world economy is under siege and that gold is the currency of last resort.”
My response: “Oh really? D'ya think the good people of Totnes know this? Maybe we should tell those ignorant folk that what they are doing is impossible – that it can't be done?! That gold is the only way.”
Conclusion
The technical evidence suggests that, whilst the gold price is certainly and without doubt still in a Primary Bull market, there is a possibility – admittedly small – that it could hold some surprises on the downside; and that these surprises (if they manifest) could be extremely painful.
Long terms holders should remain holding. Traders should recognise that it is more important in the current economic environment to be focussing on capital preservation than on capital growth. The time has come for you to curb your gambler's instincts.
By Brian Bloom
You may now order your copy of Beyond Neanderthal from www.beyondneanderthal.com . My guess is that we will both be glad you did. The feedback from readers has been very positive, and I am grateful for that. Via its light hearted storyline, the novel points a direction as to what we should be doing in the event that global cooling starts to manifest; and it also sows some seeds of ideas on how we might defuse the clash of civilisations
Copyright © 2008 Brian Bloom - All Rights Reserved
Disclaimer: The above is a matter of opinion provided for general information purposes only and is not intended as investment advice. Information and analysis above are derived from sources and utilising methods believed to be reliable, but we cannot accept responsibility for any losses you may incur as a result of this analysis. Individuals should consult with their personal financial advisors.
Brian Bloom Archive |
© 2005-2022 http://www.MarketOracle.co.uk - The Market Oracle is a FREE Daily Financial Markets Analysis & Forecasting online publication.


