Recession Signals - Daylight, Nighttime, And Cycles Of Risks And Opportunities
Economics / Recession 2019 Jan 23, 2019 - 03:58 PM GMTBy: Dan_Amerman
 Numerous warning signals of a coming recession have appeared recently, and there have been rapid changes in bond prices, stock prices and Federal Reserve policies.
Yet, the stock market indexes are rising again, and the economic and financial fundamentals remain strong in many ways. Are the widespread fears of recession overblown?
In the search for answers, this analysis explores 164 years of economic history, and the 34 previous "night and day" iterations of recession and expansion. By studying the average expansion and recession, many insights can be gained in terms of what economies look like shortly before recession, and whether history shows that the current robust economic statistics are in fact a reliable argument against another recession starting within the next 1-2 years.
This analysis is part of a series of related analyses, an overview of the rest of the series is linked here.
Four Key Recent Developments
There have been four key recent developments when it comes to the likelihood of a recession within (about) the next one to two years.
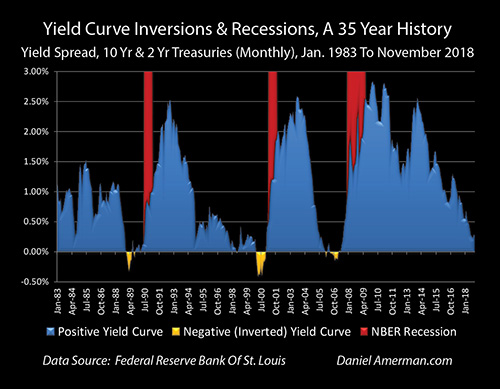
The first development can be seen in the graph above, which is that we remain very close to a potential yield curve inversion. As explored extensively in the analysis linked here, the unusual event of long-term yields being lower than short term yields has in past decades been a remarkably accurate warning signal that a recession will occur within the next 1-2 years. While an inversion has not actually occurred in the most watched areas, we are still the closest to an inversion that we have been since 2006.
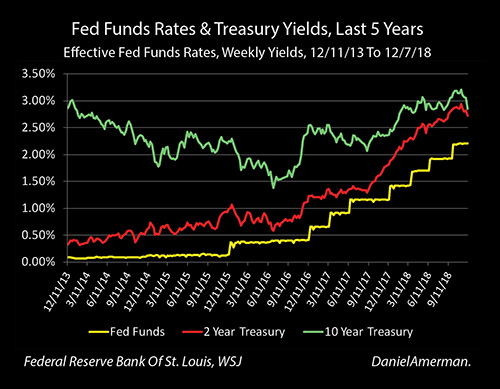
Most importantly the source of the near inversion at this stage is not the "floor coming up" in terms of Fed short term rate increases, but rather the "ceiling coming down" in terms of fast falling long term yields. As explored in the analysis "Three Beautiful Arbitrages (Why Yield Curve Inversion Happen)" (linked here), yield curve inversions are not some arcane technical indicator, but are the result of a highly profitable strategy used by sophisticated investors who bring down long term rates in the process of executing the strategy - which is exactly what we have recently been seeing.
We've also had an extraordinary amount of volatility in the stock markets. Fears about trade wars, economic growth, slowing earnings and recession all played key roles in the fast declines in stock prices.
We've also seen a big change in Federal Reserve policy, specifically because of the issue that they are concerned about economic growth. After two years of steady interest-rate increases, in their December meeting the Federal Reserve abruptly backed off from the prior regular message to the markets, which was to expect a series of future interest-rate increases.
Indeed if we look at statements by Chairman Powell and other voting members of the Federal Open Market Committee since the December meeting, the chances look high that the Fed has at the least paused the cycle. They no longer have a public plan for steadily increasing interest rates, but rather they will wait, see what happens, and react to developments.
It is interesting and important to note that the last time that the Fed stopped a cycle of increasing interest rates and hit the "pause" button to see what happened next - was the year 2006. This was the same year as the last yield curve inversion, and the Great Recession followed in less than two years.
The previous time that there was a yield curve inversion and the Fed paused a cycle of increasing Fed Funds rates - was the year 2000. The collapse of the tech stock bubble and the sharp recession of 2001 also followed in less than two years.
The time before that can also be seen in the "Yield Curve Inversions & Recessions" graph, and it was the year 1989. A yield curve inversion occurred, the Fed paused a cycle of increasing Fed Funds rates that had been in process - and the recession of 1990 followed, more or less right on schedule.
The Normality Of Recessions
For most people - recessions do not seem like a normal event. Why recessions occur is not intuitive for most people, so there is little reason to expect another one anytime soon. However, what history shows us is that recessions do occur, they are entirely normal and they are common.
The National Bureau of Economic Research has studied the United States economy back to December of 1854, and has attempted to identify each month of economic expansion and each month of recession during that time.
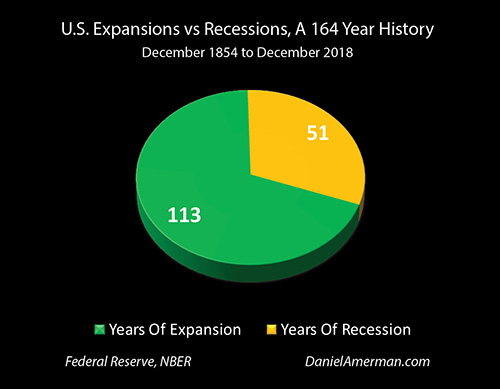
As we can see in the pie chart above, which is based on their research, the NBER estimates that the United States economy has experienced 113 years of expansion since 1854 - and 51 years of recession.
Now, 51 years is an enormous amount of time. So what 164 years of United States history shows us is that recessions are normal, and they are every bit as normal as expansions.
Yes, recessions are not quite as dominant as expansions. The long-term averages are for the nation to be in expansions about 69 percent of the time and in recessions about 31 percent of the time. So, in any given year we are more than twice as likely to be in an expansion than we are to be in a recession.
That said, let me suggest that if someone is on average likely to spend almost a third of their life in recessions - then recessions are not an aberration, they're not the unusual, they're not an uncommon event, but rather recessions are a core part of normality.
Another way of looking at this is that 164 years of history show us that retirement and long-term investors should plan on their portfolios experiencing recessions for almost a third of their retirements. This is a critical perspective, because so many people think about their retirement cash flow in terms of the income they taking in from interest payments and dividends, and the amount for which they are able to sell their assets, with an assumption that this will all be occurring within a period of steady expansion.
But if we simply look at the long-term averages, and use the example of a 20 year financial plan for someone who retires at 65 and expects to live to about age 85 - then their financial plan should arguably be able to handle six years of potentially stressed cash flows and six years of liquidating assets at potentially severely depressed prices, while still having enough money cover living expenses. How many people are prepared for that?
The Cyclical Nature Of Recessions
There is something else that is very well understood about expansions and recessions and that is that they are cyclical.
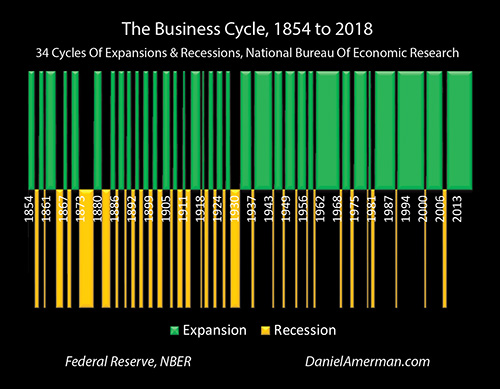
The graph above shows expansions in green and recessions in gold. As can clearly be seen, the long term norm is for the nation to cycle back and forth between the two. According to the National Bureau of Economic Research we've had 34 cycles of recessions and expansions over their 164 year study period. This can be looked at as an average of a recession every 4.8 years.
This is also called the "business cycle." It is a highly, highly reliable cycle, the existence of the business cycle is not open for debate, and it is part of the very core of economics and economic history.
We currently have a near record length of time without a recession, at least according to government statistics. So, we have two components going on here. First, we have a 164-year-old cycle - that of course actually goes back much further than that in time. Recessions and expansions have been occurring for thousands of years, this is just the time period that has been studied and labeled by the National Bureau of Economic Research. Second, we have had 34 iterations of the cycle over that time and we've already gone twice as far as we should be going - based on long-term averages - without a recession.
Now, as can readily be seen, the pattern has changed since the end of World War II, and this is because of the critical factor of Federal Reserve interventions and attempts to change the cycle. These interventions are not the focus of this particular analysis, but will be the subject of following analyses in this series
A Consistently Counterintuitive Cycle
Many investors are strongly of the opinion that when we look at currently still robust economic data and corporate profits, that a recession is emphatically not on the way. They are certain of this, and they are not particularly interested in having their beliefs challenged. That is fair enough, people should be free to invest their own money based on their own beliefs.
However, there are a lot of other people out there who are uncertain about what to believe, and they have some critically important personal decisions to make when it comes to their investments and the possibility of recession. These decisions could be a major determinant of what happens when it comes to their actual future financial security and standard living in retirement. Therefore, it is very important for them to have an idea whether indeed it is likely that we may be coming into a recession, or whether that possibility can be completely dismissed.
For someone who falls in that category, let me suggest a useful screening mechanism when it comes to sorting out the different arguments. As previously covered, since 1854 we've had 34 recessions in 164 years. Here's the key question: how many of the people who say that they don't see a coming recession can explain the prior 34 recessions? Do they understand the cycle at all over these previous 164 years?
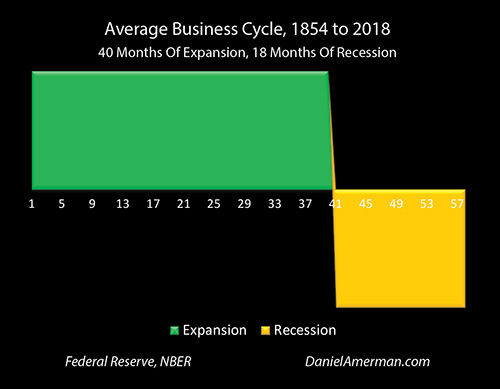
The graph above is of the average length of the business cycle over 164 years of economic experience in the United States. What it shows is that over that time the average expansion was 40 months, the average recession was 18 months and the average total length for each of the cycles was 58 months, or 4.8 years.
Within each 40 month expansion that would mean that on average the middle of the expansion, the very heart of the expansion, would be occurring about 20 months after the expansion started. From the very heart of that prosperity, from the very possible best possible conditions, what history tells us is that the next recession will on average arrive in less than two years.
What 34 iterations over 164 years shows us is that 20 months is on average the midpoint of the expansion, and 20 months after the heart of that expansion is the beginning of the next recession.
What makes this really interesting, as covered in the analysis "Three Beautiful Arbitrages - Why Yield Curve Inversions Happen" (linked here) is that the bond market has been coming very close to making the call that a recession will arrive within the next 1-2 years. When the bond market has made this call in the past, it has been with a remarkable degree of accuracy. And that time period also falls into the 20 month average time interval from the heart of prosperity to the beginning of recession, that we find when looking at 164 years of history.
However, for the average person who isn't a professional investor, this may make no sense at all. How could the heart of prosperity so reliably (on average) flip into financial and economic despair in less than two years?
It just seems completely counterintuitive, but yet it is exactly what has happened - on average - 34 times in a row.
Daylight, Nighttime, And Cycles Of Risks And Opportunities
In the attempt to better understand the cycles - and potentially substantially reduce the risks and increase the rewards for many investors - let's use the analogy of a different cycle which we are all quite familiar with, and that is the daily rising and setting of the sun.

We do have that 164 year cyclical history that is repeated above, and what it shows is the sun going down 34 times - and then the sun coming up 34 times. Unlike our planetary day and night cycles the economic and investment cycle sun is up in the sky for more than twice as long as it is below the horizon, with 113 years of expansion out of the last 164 years.
As introduced in the beginning of this analysis, we have numerous economic and financial indicators that are all beginning to flash red, some of which have been shown to be highly reliable indicators that the sun is getting ready to set again. This was starting by the summer of 2018, and the warning signals grew much stronger by December of 2018.
At the same time - the current expansion in the United States still seems quite robust. We have numerous economic and financial indicators are strongly positive.
So there are numerous commentators and analysts who are using vast numbers of very convincing statistics and charts to show that there's no need to worry about recession. Worrying about a recession just doesn't make any sense from where we are in terms of this robust expansion.
For an average person -- it may seem easier to believe that the overwhelming amount of positive data means that the no recession is imminent. Or at worst, they may believe that it is a toss-up, with even chances of a recession or not.
This is particularly the case because following trend lines is a very intuitive process. There is also the consideration that if following current positive trend lines produces desirable results from an emotional perspective, then this creates a double positive for most people.
Indeed, what tends to happen in each cycle - is that a large number of investors stop believing in nighttime. There are always reams of data to support them. And the results are emotionally comforting as well.
Indeed, they can become quite aggressive in their beliefs, and sometimes label those who believe in the possibility of nighttime as pessimists, doom and gloomers, or even as ghouls or vampires.
This belief system can work pretty well - until the sun goes down, yet again. At that point what can happen to the retirement portfolios of those who are fully invested in the impossibility of nightfall, is not a pretty picture.
That brings us back to the heart of the dilemma. This exact same process of showing that the sun logically will not set could have been done 34 times in a row, and 34 times in a row - the overwhelming trend lines of robust economic and financial statistics found in the very middle of the expansion would have been broken. Thirty-four times in a row a recession would have arrived in (on average) less than two years, and the sun would have gone down.
Each time the process would have been non-intuitive, and what this means is that the average person - with a high degree of reliability - would have been wrong 34 times a row for reasons that would make no sense to them before or afterwards. If that average person had made investment decisions that were based on the easily intuitively understandable case for continued expansion, and were therefore exposed to downside risk with recessions, then they would have been blindsided by unexpected losses - sometimes severe losses - 34 times in a row.
Seeing The Sunrise That Follows
There is another large group and they are very closely watching as the sun appears to be going down in the sky, because they await the eternal Nighttime. They believe the markets will collapse, the system will blow apart and it will be monetary collapse and depression into the indefinite future. Well, it could be.
However, while it is indeed possible that the sun might not come up again for a very long time, this belief requires an even more remarkable proof than the proof which is required to support the assertion that the sun will not go down. The sun has risen from the depths of night 34 times in a row. And the sun has stayed in the sky for 69% of the last 164 years.
Assuming that the sun does come up again, it is that dependable and cyclical transition from the black depths of night, to the glorious sunrise, to the brilliant light of noontime, that is the most profitable part of the cycle in most investment categories. This is the time when fortunes are made and the peak investment growth over a lifetime can occur.
The cycle then leads to another mid-afternoon, the peak heat of the day, as the sun slowly lowers in the sky - even as increasing numbers of investors (in a highly reliable cycle) stop believing in the nighttime.
If the sun does indeed go down for a 35th time - how an investor survives the nightfall or even prospers with the nightfall will be of critical importance. And if after the depths of night, with assets preserved, there is another glorious dawn and then another brilliant day, seeing and embracing the 35th iteration of this natural and reliable cycle could be the single most important thing that an investor can do, particularly an investor who is retired or nearing retirement.
Our Amplified Modern Cycles
The startling and radical conclusion of this analysis is that the odds are pretty strong that the sun will go down again at some point, for the 35th time since 1854. And that the odds are also pretty strong that the sun will come up again, for a 35th time.
Yet, what is remarkable is how few investors are fully prepared to not only protect themselves from another iteration of the cycle, but to anticipate the cycle and take advantage of the cycle. Despite having already personally lived through many cycles, there are nonetheless numerous people who are either not taking into account that the sun could go down again, or have lost faith that it could also rise yet again.
This analysis is part of a much broader body of work that has been developed over many years. As is readily apparent in the graph of the 34 previous cycles, the business cycle has looked quite different since the end of World War II than it did before.
The more natural expansions and recessions of the past have been replaced by the increasingly active interventions of the Federal Reserve. In the last couple of decades these interventions have reached new levels with such radical changes as zero percent interest rate policies and creating trillions of dollars in new money out of the nothingness via quantitative easing - with all of this happening for the express purpose of changing the business cycle.
As explored in the analysis linked here, these extraordinary interventions by the Federal Reserve have not repealed the business cycle. Instead they have created amplified boom and bust cycles of crisis and the containment of crisis, with much deeper investment losses during the "night" and record-setting investment gains during the "day".
Building from the base of this analysis, the following analyses in this series will take a closer look at how the Fed has been intervening, and how this has been changing the cycles as well as transforming investment results across all the categories.
Daniel R. Amerman, CFA
Website: http://danielamerman.com/
E-mail: mail@the-great-retirement-experiment.com
Daniel R. Amerman, Chartered Financial Analyst with MBA and BSBA degrees in finance, is a former investment banker who developed sophisticated new financial products for institutional investors (in the 1980s), and was the author of McGraw-Hill's lead reference book on mortgage derivatives in the mid-1990s. An outspoken critic of the conventional wisdom about long-term investing and retirement planning, Mr. Amerman has spent more than a decade creating a radically different set of individual investor solutions designed to prosper in an environment of economic turmoil, broken government promises, repressive government taxation and collapsing conventional retirement portfolios
© 2019 Copyright Dan Amerman - All Rights Reserved
Disclaimer: This article contains the ideas and opinions of the author. It is a conceptual exploration of financial and general economic principles. As with any financial discussion of the future, there cannot be any absolute certainty. What this article does not contain is specific investment, legal, tax or any other form of professional advice. If specific advice is needed, it should be sought from an appropriate professional. Any liability, responsibility or warranty for the results of the application of principles contained in the article, website, readings, videos, DVDs, books and related materials, either directly or indirectly, are expressly disclaimed by the author.
© 2005-2022 http://www.MarketOracle.co.uk - The Market Oracle is a FREE Daily Financial Markets Analysis & Forecasting online publication.


