Will the Nasdaq Hit 10,000 This Year?
Stock-Markets / Tech Stocks Jan 23, 2019 - 07:35 AM GMTBy: Harry_Dent

 Who would have thought I would be forecasting that the Nasdaq could zoom to 10,000 this year?
Two things have changed my perspective in recent months: The Q4 2018 crash didn’t approach the typical 40% loss in the first two to three months, as was typical of most major bubbles… and my newer 90-Year Bubble Buster Cycle.
That 90-year Cycle is a “double variation’ of my proven 45-Year Innovation Cycle. It has marked the greatest bubble peaks and “resets” since the Industrial Revolution (1837 to 1842 and 1929 to 1932).
If the current correction doesn’t crash down much harder by early February – which doesn’t look likely at this point – then a final blow-off rally would be most consistent with past major bubbles, especially the ones that hit on this 90-year cycle.
What I’ve Been Looking At…
I’ve been looking at the finally bubble rallies on all the key indices: The S&P 500, the Dow, and especially the Nasdaq because it’s the lead bubble of the lot.
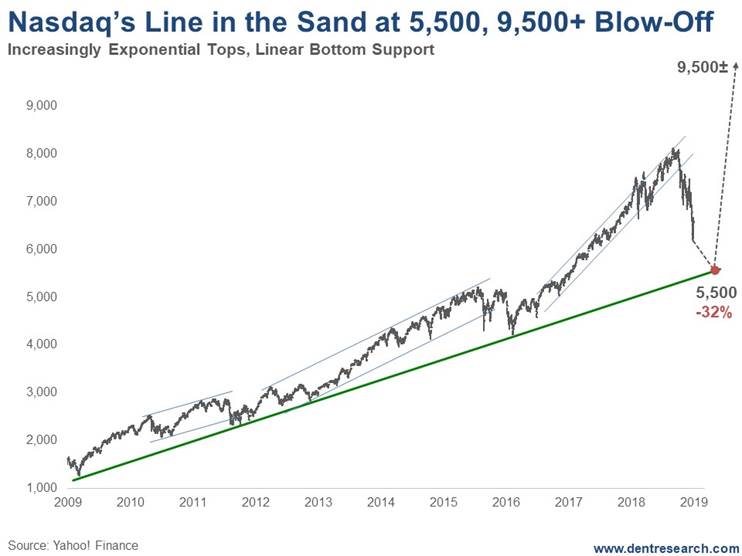
What I am noticing is that the best support on the final rallies since early 2009 come from a linear trend-line through the bottoms, but the best rally and upside targets come from exponential trend-lines through the tops.
Here’s my best chart for the leading Nasdaq…

What This Chart Is Telling Us…
First note that bottom linear trend-line. It comes through at around 5,500 in early February.
The same trend-line on the S&P 500 comes through around 2,300 currently and will be hit first, and hence, be the first warning, if broken, that this Nasdaq support line could be hit. Again, the Nasdaq is the trump card here.
Next note the progressive nature of the rally.
The first wave into 2011 was more normal.
The next wave into 2015 was more exponential.
The most recent wave into late 2018 was more exponential again.
The markets are making similar point-gains in 38% of the time in each successive wave – that is THE definition of exponential and bubbles are the most exponential scenarios.
What Does This Mean?
So, if the markets can hold key support ahead, especially by early February, the next rally would project to around 9,500 on an exponential trend, or as high as 10,000 if it makes similar point gains to the last rally in 38% of the time. That takes us into late 2019/early 2020.
From the recent lows of 6,190, that’s a 53% to 62% gain.
From the bottom trend-line of 5,500 if reached, that’s 73% to 82%!
If we can hold the 2,300 level on the S&P 500 in the next month, this bullish scenariobecomes much more likely.
Should we hold the bottom trend-line on the Nasdaq, around 5,500 currently, it could still follow this extremely bullish scenario.
If the S&P breaks 2,300 substantially suggesting a top in late 2018, then it could just retest its highs, while the Nasdaq rings the big bell with major new highs, assuming it holds 5,500. That would also be consistent with past bubble tops.
I cover the most basic bullish and bearish scenarios in the latest January edition of Boom & Bust. Don’t miss that issue and keep it handy as I’ll refer to it in updates in the weeks and months ahead.
One way or the other, 2019 looks to be very different than what many on Wall Street expect. It’s very likely to either be very bullish or very bearish. Not the middle ground they’re suggestion. And I’m still favoring the bullish scenario unless proven otherwise.
We will keep you updated.
Harry
Follow me on Twitter @HarryDentjr
P.S. Another way to stay ahead is by reading the 27 simple stock secrets that our Seven-Figure Trader says are worth $588,221. You’ll find the details here.
Harry studied economics in college in the ’70s, but found it vague and inconclusive. He became so disillusioned by the state of the profession that he turned his back on it. Instead, he threw himself into the burgeoning New Science of Finance, which married economic research and market research and encompassed identifying and studying demographic trends, business cycles, consumers’ purchasing power and many, many other trends that empowered him to forecast economic and market changes.
Copyright © 2019 Harry Dent- All Rights Reserved Disclaimer: The above is a matter of opinion provided for general information purposes only and is not intended as investment advice. Information and analysis above are derived from sources and utilising methods believed to be reliable, but we cannot accept responsibility for any losses you may incur as a result of this analysis. Individuals should consult with their personal financial advisors.
© 2005-2022 http://www.MarketOracle.co.uk - The Market Oracle is a FREE Daily Financial Markets Analysis & Forecasting online publication.


