Yield curve suggests that US Recession is near: Trading Setups
Stock-Markets / Financial Markets 2019 Jan 11, 2019 - 10:26 AM GMTBy: FXCOT
 Investors think recession risk is quite high. This, though, raises another question: Since investors have access to the same news and data as the Fed, how can they know the economy better than the Fed? Economist Jesse Edgerton of J.P. Morgan has found that economic data has a better record of predicting recession than the yield curve and right now, the data sees lower odds than the yield curve. Short-term interest rates are set by the Federal Reserve, and long-term rates by bond market investors. The curve has been flattening for the past two years as the Fed has slowly raised short-term rates in hopes of a “soft landing,” a slowing in growth that keeps both unemployment and inflation low and stable. But in recent months the flattening has been driven by falling bond yields. The usual interpretation: Investors in their collective wisdom think the Fed is overdoing it with rate increases and could shove the economy into recession, in which case short-term rates will be lower in a few years than they are now.
Investors in their collective wisdom think the Fed is overdoing it with rate increases and could shove the economy into recession, in which case short-term rates will be lower in a few years than they are now.
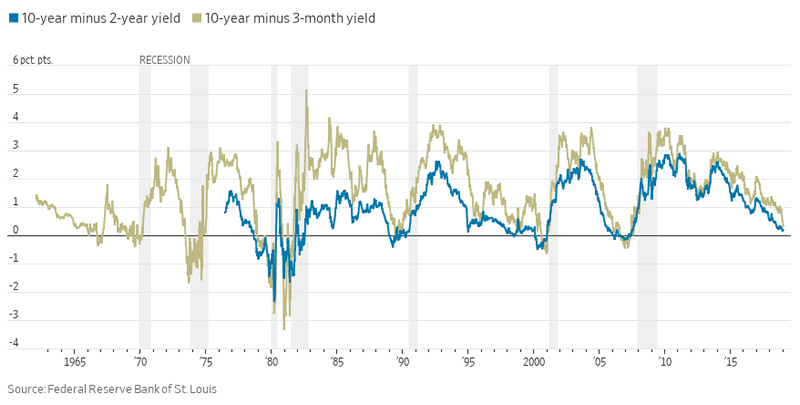
The yield curve can act as self fullfilling prophecy. When the long end of the curve starts to fall, it can trigger a herd mentality where more money will start to feed into the safety of long term treasuries. So in a way the inverting of the curve will not only predict the recession but causes it.
We attach some major charts and the market trading setups Dollar Index
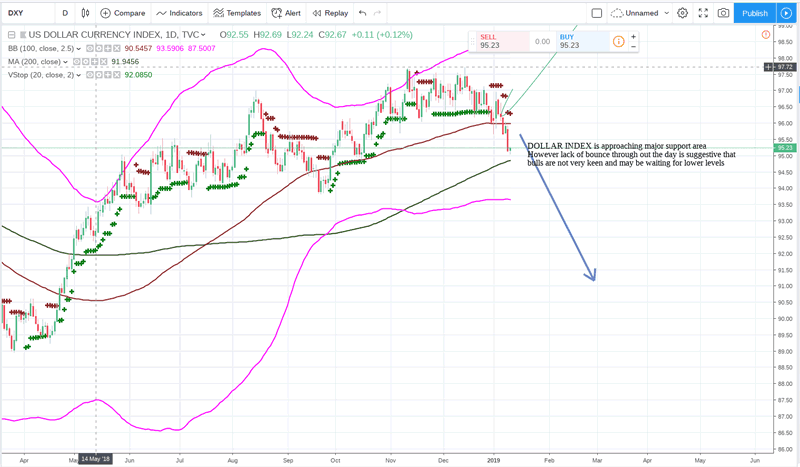
Dollar Index has fallen below our key support level at 95.5. No bounce of these levels suggests there could be some more bearish pressure. Unless the FED is outright bullish when they talk later today, the narrative may not change. Risk aversion will be another trigger for some more dollar rally. We continue to suggest to clients to not trade manually or based on charts and indicators. Our trading system is pure price action based system which trades on BREAKOUT and Volatility and SCALPING. These are systems used in professional bank desks on super select prop desks. It takes out imagination fueled trades based on charts. If you would like to connect your mt4 to our system, please contact us
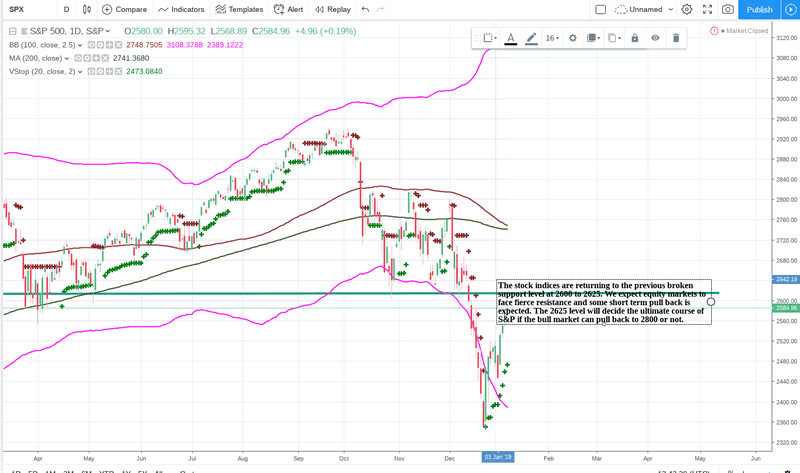
The stock indices are returning to the previous broken support level at 2600 to 2625. We expect equity markets to face fierce resistance and some short term pull back is expected. The 2625 level will decide the ultimate course of S&P if the bull market can pull back to 2800 or not.
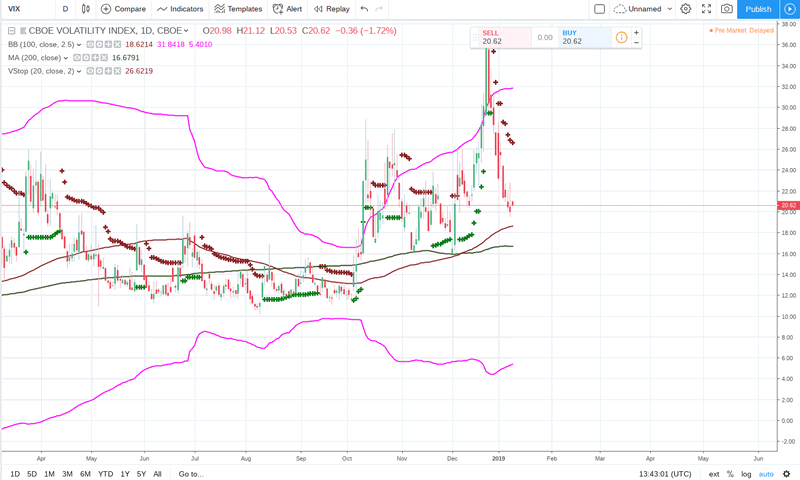
The fear index, vix, is pointing to some short term bounce in volatility. The index has been continuously above 20 levels and has made trading far ore costly.
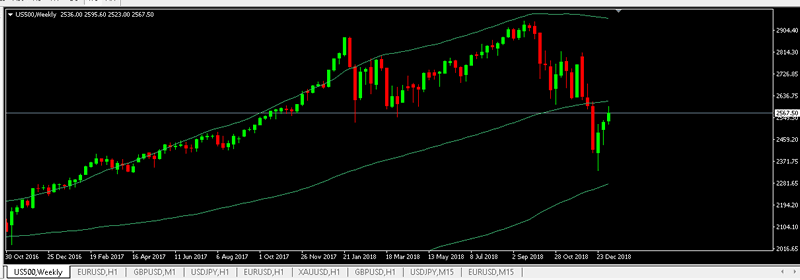
The weekly charts of ifutures show overhead resistance at 2630/25. We see those levels in play. The resolution of China trade talks and potential NK meeting will take it there.
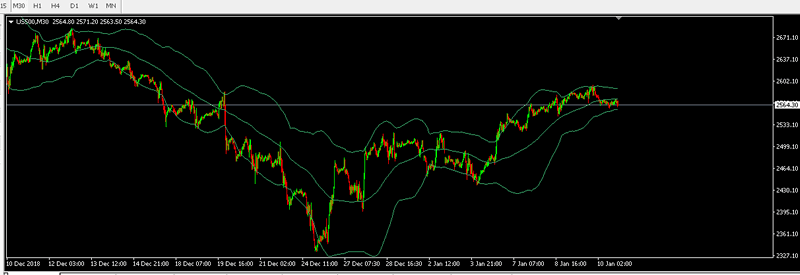
The 30 min of the continuous futures, suggests that prices are not backing away yet of the strong overhead resistance. There could be further strength left in the rally before exhaustion. Bear market rallies can be sharp and take out almost all the bears. Be careful if you are a early shorter.
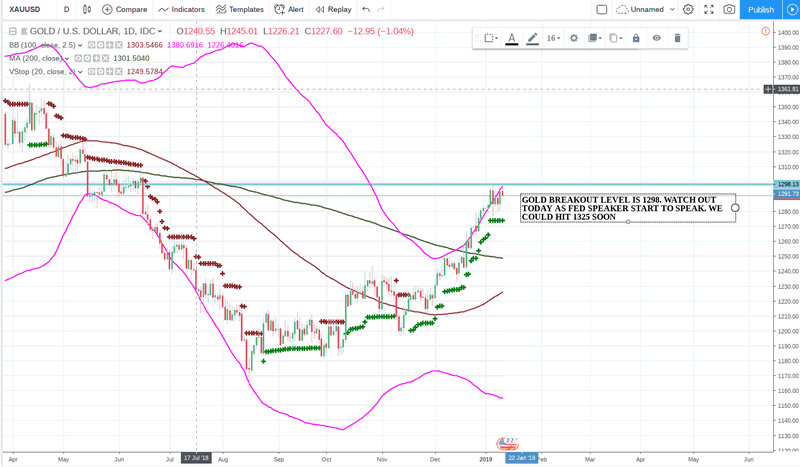
GOLD is near breakout level. 1298 level is the barrier and once it clears, we could push to 1325. Watch out for dovish fed commentary today.
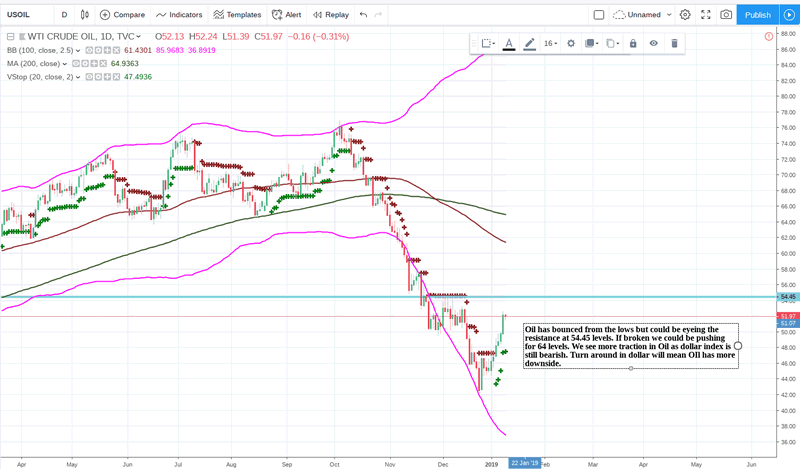
Oil is nearing strong resistance at 54. A breakout above 54 could see some string upside move to 64. Only dollar strength can put a lid on oil.
Onto forex markets, things are dicey and difficult. Forex markets have become virtually impossible to trade for the small time retail trader trying to decipher charts and indicators. It simply is a 50:50 game. That is the reason why we rely on one of the world most profitable and secretive trading systems in the world. It operates on EURUSD, GBPUSD, USDJPY and GOLD. It trades automatically with complete risk management.
Yesterday, when EURUSD broke out from 1.1482 to 1.1569, thousands of traders were caught short as the pair broke out.There was no specific reason for the price action. A normal trader would have missed the whole move. But FXCOT system entered long at precisely the break out level and rode the whole move to 1.1569. It is just the latest example of the perfection of the system.
EURUSD breakout was traded by FXCOT TRADE COPIER
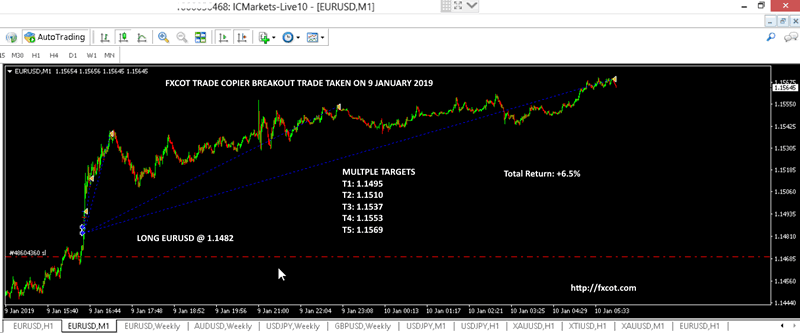
See above how it went long at 1.1482 and kept initial stops at 1.1450 and then later to breakeven and later to trailing stops to protect stops. This is just one of the examples of the trades it has taken among hundreds available for scrutiny.
The system has made +6.5% in January, 2019. It performance in 2018 has been stellar where it made +130% return. See the performance below.

January returns are interim as we are still trading. These results are realised on client accounts and it could be on yours. All you need is a MT4 terminal from a world leading forex broker. You can apply here: New Application for MT4 account for FXCOT system .
Please contact us if you have any queries
FXCOT is Investment Management firm specializing in futures and forex trading. We run a high return trading system for our premier clients. The trading systems uses four different strategies to take advantage of various market conditions. We also send daily trade setups and economic commentary.
© 2019 Copyright FXCOT - All Rights Reserved Disclaimer: The above is a matter of opinion provided for general information purposes only and is not intended as investment advice. Information and analysis above are derived from sources and utilising methods believed to be reliable, but we cannot accept responsibility for any losses you may incur as a result of this analysis. Individuals should consult with their personal financial advisors.
© 2005-2022 http://www.MarketOracle.co.uk - The Market Oracle is a FREE Daily Financial Markets Analysis & Forecasting online publication.


