


Stock Market Invstors Be Careful Going Into 2019
Stock-Markets / Stock Markets 2019 Jan 03, 2019 - 03:54 PM GMTBy: Troy_Bombardia

With the start of a new year, some of these market studies are going to look at the stock market in 2018 and see what that implies for 2019.
Go here to understand our fundamentals-driven long term outlook.
Let’s determine the stock market’s most probable medium term direction by objectively quantifying technical analysis. For reference, here’s the random probability of the U.S. stock market going up on any given day.

*Probability ≠ certainty. Past performance ≠ future performance. But if you don’t use the past as a guide, you are walking blindly into the future.
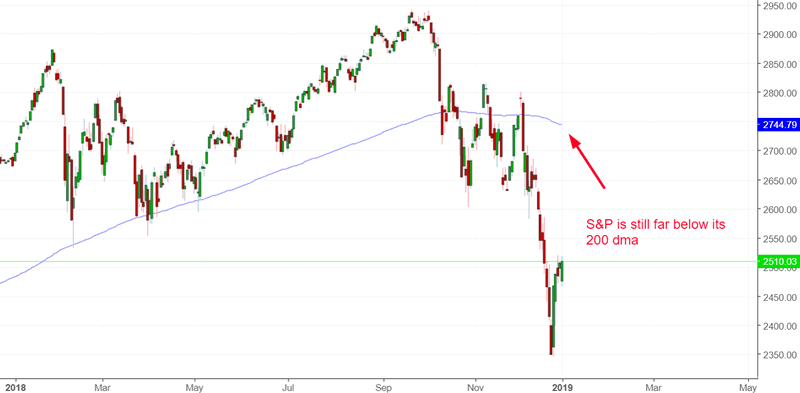
The rising U.S. Dollar vs. stocks
Contrary to popular belief, a rising U.S. Dollar isn’t consistently bearish for stocks.
- Sometimes stocks go up when the USD rises
- Sometimes stocks go sideways when the USD rises
- Sometimes stocks go down when the USD rises.
However, when stocks do fall while the USD goes up, stocks tend to fall more in the future. This is similar to our interest rates study.
Here’s what happens next to the S&P 500 when the S&P falls during a calendar year while the U.S. Dollar Index goes up.
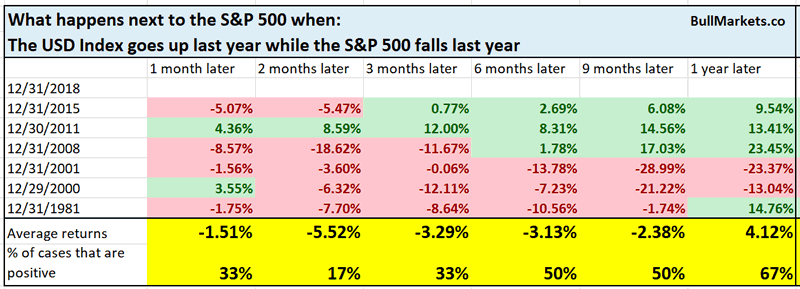
You can see the stock market’s bearish tendency over the next 2 months.
What the U.S. Dollar does
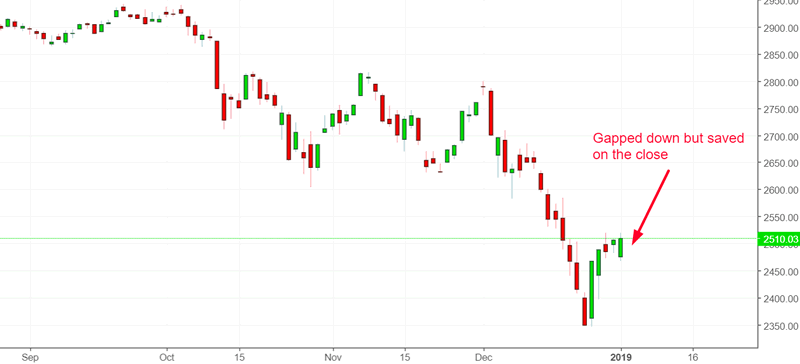
Another volatile day
It was another volatile day for the stock market. The S&P gapped down more than -1.5%, but managed to close higher than the previous day’s CLOSE.
From 1900 – present, such a large gap down and then an intraday reversal has only happened 3 other times.
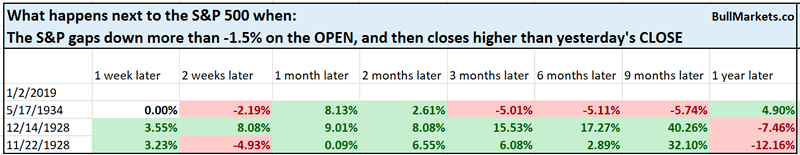
With n = 3, I wouldn’t read too much into this.
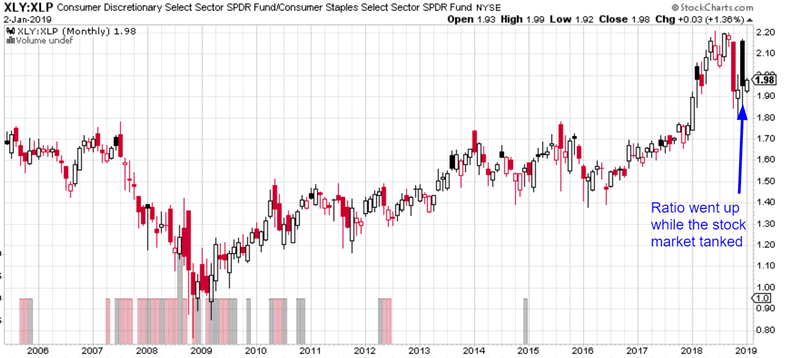
XLY:XLP
The XLY:XLP ratio (consumer discretionary vs. consumer staples) tends to move in the same direction as the U.S. stock market. But when this ratio moves in a different direction from the S&P 500, it’s a long term warning sign.
The S&P tanked in December 2018 while the XLY:XLP ratio went up.
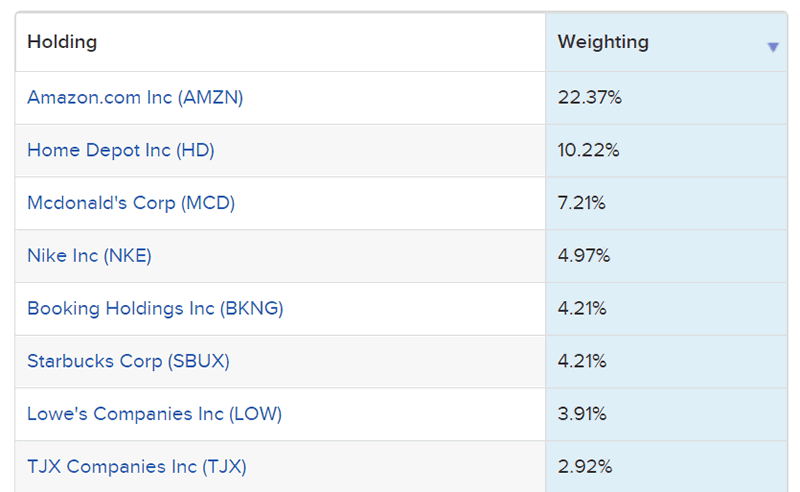
Here are XLY’s largest holdings:
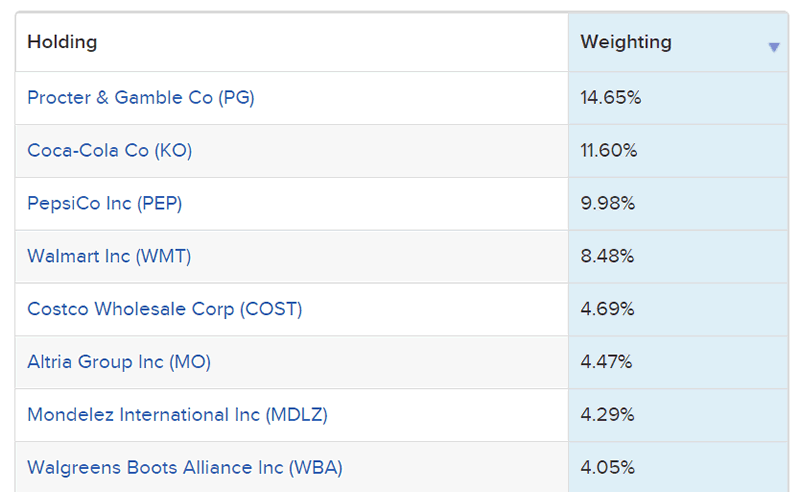
Here are XLP’s largest holdings
Here’s what happens next to the S&P when the S&P falls over the past calendar month, while the XLY:XLP ratio goes up
*Data from 1998 – present
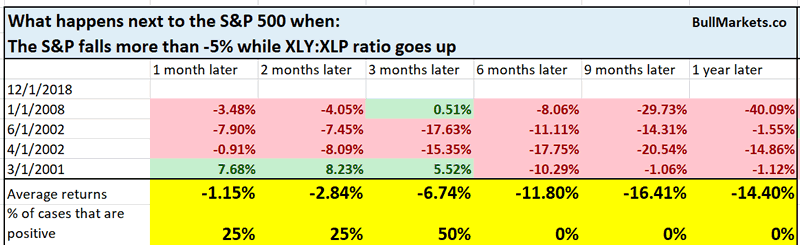
All 3 of these cases happened in bear market years.
Macro Context
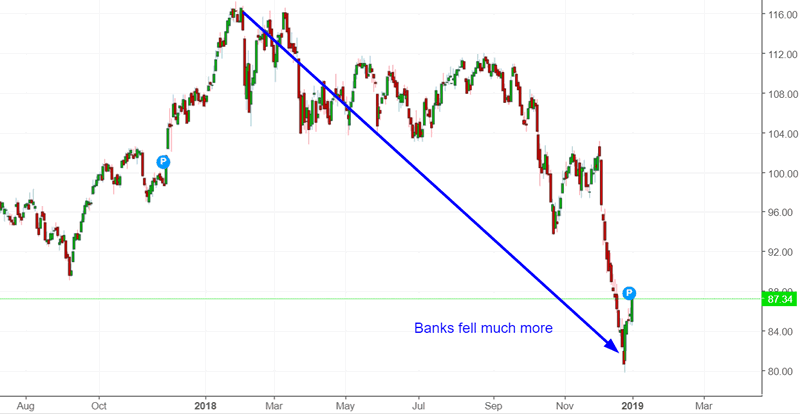
Banks
While the S&P fell -6% from the start to end of 2018, bank stocks fell much more. This is the KBW Bank Index
Here’s what happened next to the S&P when KBW fell more than -15% over the past 12 months while the S&P fell less than -7%
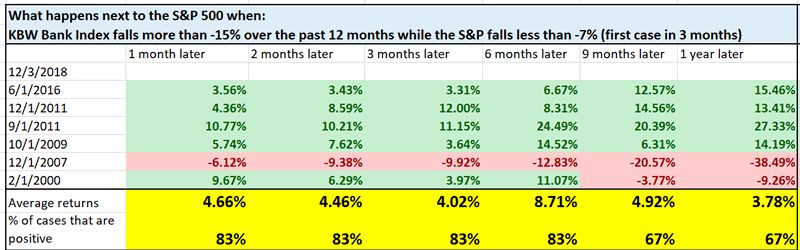
While there are 2 warning signs (2000 and 2007), the rest were bullish (2009, 2011, 2016)
Macro Context
Emerging markets
When the U.S. stock market falls, emerging markets tend to fall even more (EM is more volatile). But when the U.S. stock market falls and EM falls less, that is usually a medium term or long term bullish sign (selling exhaustion).
While the U.S. stock market tanked in Q4 2018, emerging markets didn’t fall significantly because they had already cratered from Q1 – Q3 2018.
Here’s what happened next to the S&P when EEM (emerging markets ETF) falls more than -8% over the past 3 months while the S&P falls more than -13%.
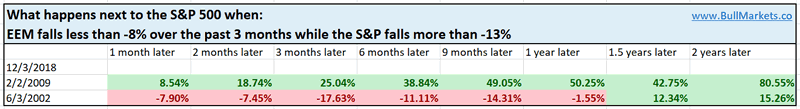
Interestingly enough, this is a long term bullish sign.
I wouldn’t see it as a long term bullish sign because both of these happened after a massive 50% decline, but I do see it as a medium term bullish sign.
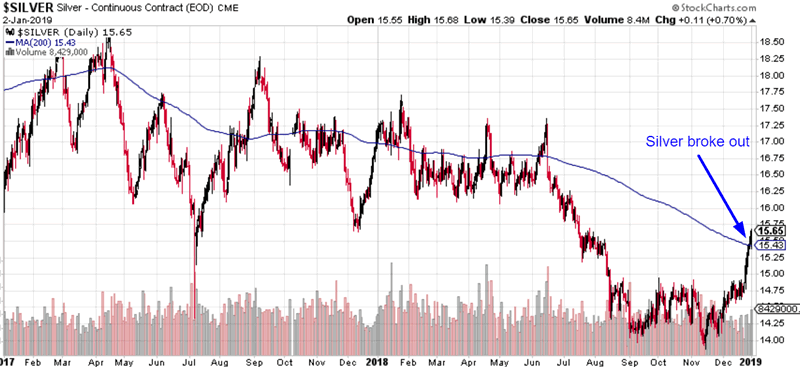
Silver and gold
Precious metals have rallied over the past few months. Silver has broken above its 200 dma for the first time in more than half a year.
Such breakouts after a long uptrend:
- Can lead to more upside in the short term
- Are usually medium-long term bearish (because long downtrends don’t usually happen in bull markets).
Here’s what happened next to silver when it closed above its 200 dma for the first time in 6 months.
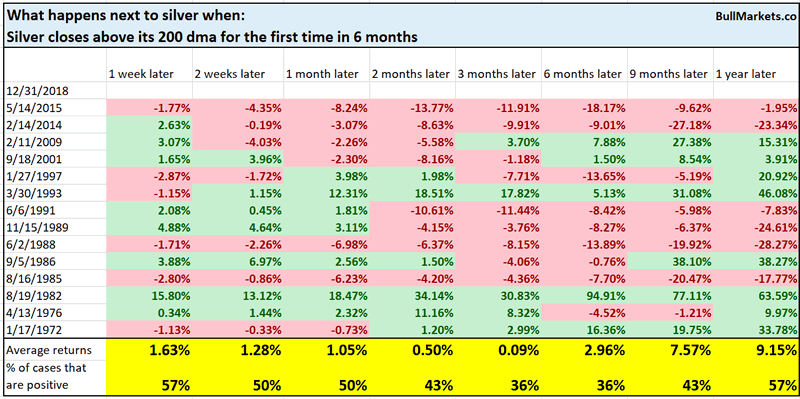
You can see how silver leans bearish over the next 3-6 months
Gold
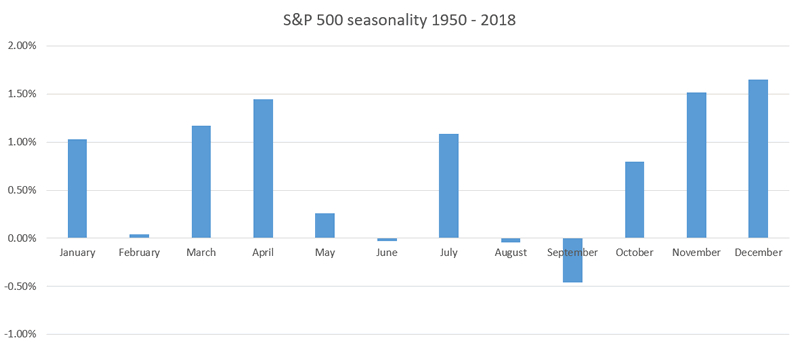
Seasonality
The stock market’s seasonality in January is moderately bullish. Seasonality factors are of secondary importance, so take this with a grain of salt.
*Seasonality was completely flipped on its head in 2018.
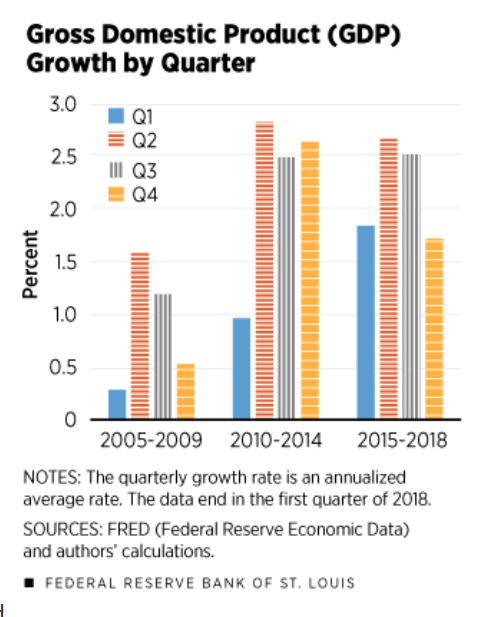
Q1 2019 GDP
Just a heads up: Q1 2019 GDP will probably be weak. According to FRED, this is due to “residual seasonality” (Q1 is almost always weak). This is why we focus on leading economic indicators instead of lagging indicators like GDP.
Click here for yesterday’s market study
Conclusion
Here is our discretionary market outlook:
- The U.S. stock market’s long term risk:reward is no longer bullish. This doesn’t necessarily mean that the bull market is over. We’re merely talking about long term risk:reward. Since no one can consistently and accurately predict every top & bottom, it’s better to focus on risk:reward than trying to catch exact tops and bottoms.
- The medium term direction is still bullish (i.e. trend for the next 6 months). However, if this is the start of a bear market, bear market rallies typically last 3 months. They are shorter in duration.
- The stock market’s short term has a slight bearish lean. Focus on the medium-long term because the short term is extremely hard to predict.
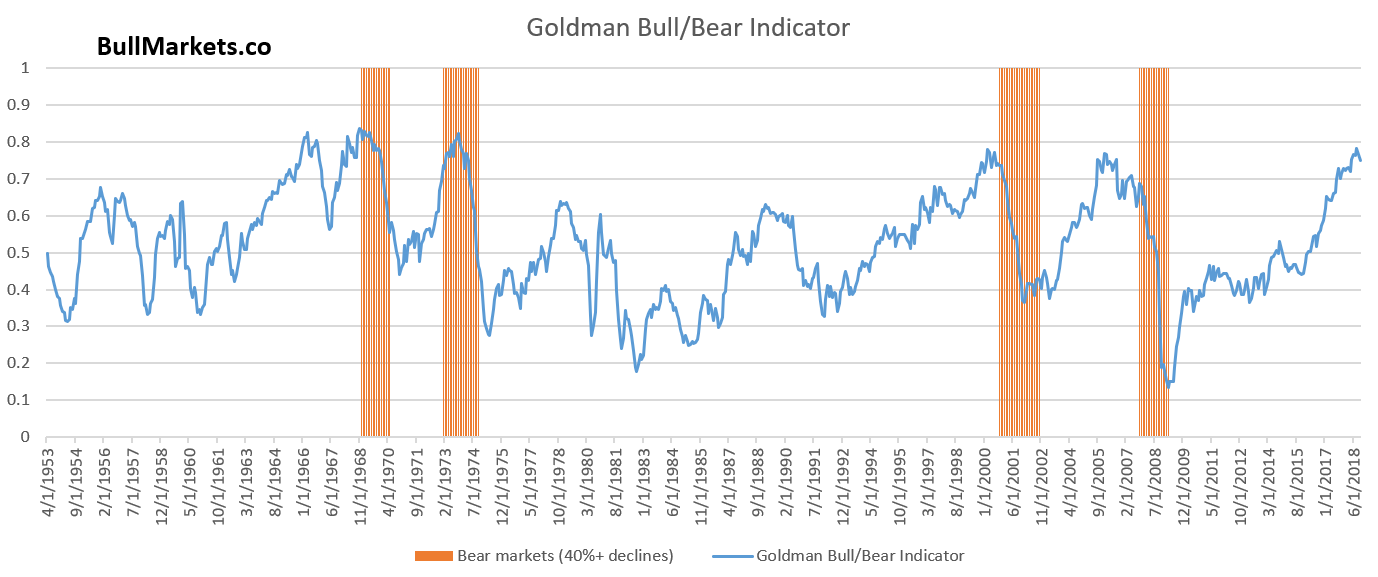
Goldman Sachs’ Bull/Bear Indicator demonstrates that while the bull market’s top isn’t necessarily in, risk:reward does favor long term bears.
Our discretionary outlook is not a reflection of how we’re trading the markets right now. We trade based on our quantitative trading models.
Members can see exactly how we’re trading the U.S. stock market right now based on our trading models.
Click here for more market studies
By Troy Bombardia
I’m Troy Bombardia, the author behind BullMarkets.co. I used to run a hedge fund, but closed it due to a major health scare. I am now enjoying life and simply investing/trading my own account. I focus on long term performance and ignore short term performance.
Copyright 2019 © Troy Bombardia - All Rights Reserved
Disclaimer: The above is a matter of opinion provided for general information purposes only and is not intended as investment advice. Information and analysis above are derived from sources and utilising methods believed to be reliable, but we cannot accept responsibility for any losses you may incur as a result of this analysis. Individuals should consult with their personal financial advisors.
© 2005-2022 http://www.MarketOracle.co.uk - The Market Oracle is a FREE Daily Financial Markets Analysis & Forecasting online publication.