Worst December for Stock Market Since the Great Depression. What’s Next?
Stock-Markets / Stock Markets 2018 Dec 22, 2018 - 05:36 PM GMTBy: Troy_Bombardia
This is officially the third worst December for the stock market since 1900. The only other 2 times the S&P fell more than -12% in December were 1930 and 1931

*I’m not saying that we’re in a Depression. Far from it. By the time this occurred in December 1930, the S&P was already down -60% while the economy saw 20%+ unemployment. That stands in stark contrast to today. This stat merely exemplifies how extreme the current selloff is.
Go here to understand our fundamentals-driven long term outlook.
Let’s determine the stock market’s most probable medium term direction by objectively quantifying technical analysis. For reference, here’s the random probability of the U.S. stock market going up on any given day, week, or month.

*Probability ≠ certainty. Past performance ≠ future performance. But if you don’t use the past as a guide, you are walking blindly into the future.
Put/Call
Yesterday we highlighted how the Put/Call Ratio had spiked to its highest level ever.

However, you can see that the Put/Call Ratio has trended higher overtime. I.e. its average from 1995 – 2005 was lower than the average from 2005-present. Hence, using an absolute value for the Put/Call Ratio doesn’t make much sense.
Instead, let’s use the Put/Call Ratio’s distance from its 50 day moving average to gauge how extreme the Put/Call spike really is.
Here’s what happened next to the S&P when the Put/Call Ratio was more than 65% above its 50 dma (i.e. right now).
*Data from 1995 – present

Interestingly enough, the stock market tends to go down 1 week later, but there’s a solid 3 month rally later, even in bear markets.
Keep in mind that this stat is as of Thursday, and the S&P fell this Friday.
Terrible 3 weeks
The S&P is down more than -7% this week. While that seems bad, it’s the 61st worst week from 1900 – present
Here’s what happened next to the S&P when it fell more than -7% in 1 week
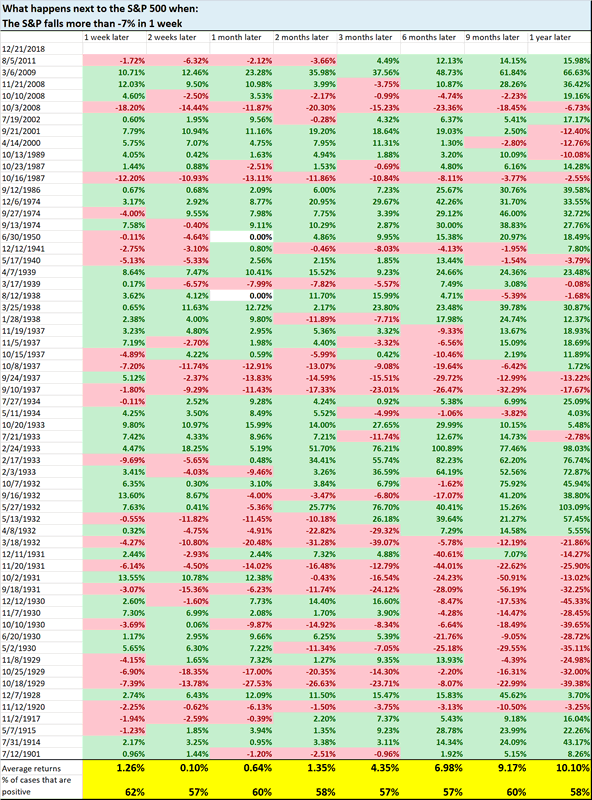
As you can see, this is not consistently bullish or bearish for stocks on any time frame.
But more importantly, this -7% weekly decline comes after 2 additional weeks of selling. Is this a sign of “capitulation selling”?
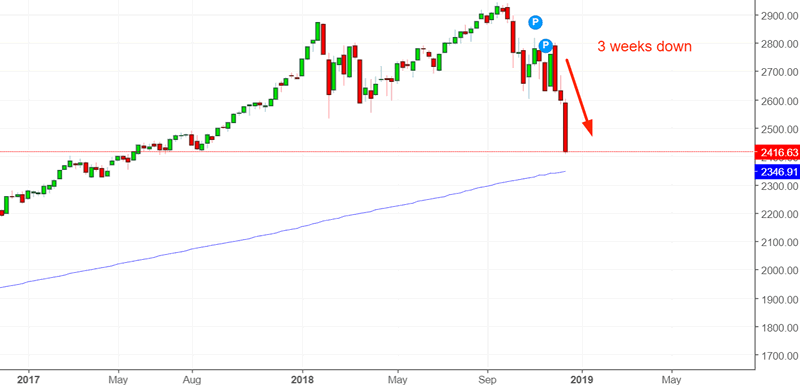
Here’s what happened next to the S&P 500 when it fell 3 weeks in a row, and more than -7% on the final week.
*Data from 1900 – present
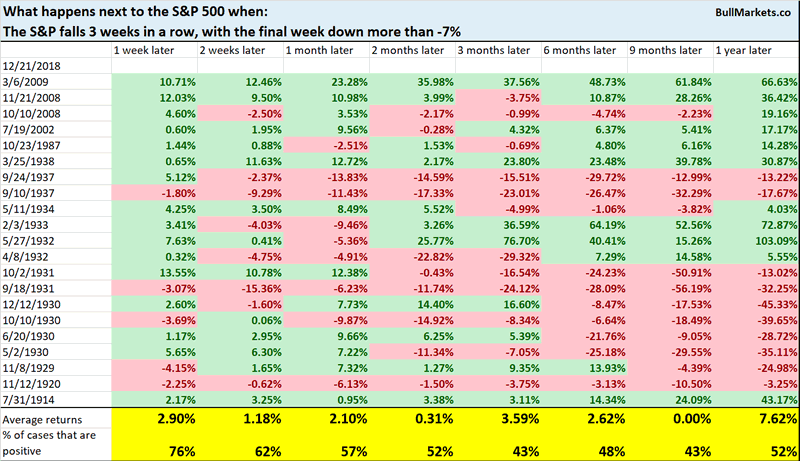
Here you can see an interesting dichotomy. This was pretty bullish after 1950, but was pretty bearish before 1950 due to all the Great Depression dates. But as we outlined for members here, the S&P’s data before the 1950s is inaccurate because it fails to take into account dividends, which were much higher before 1950s than after the 1950s.
So looking at the cases that occurred after 1950….

It’s interesting that all of these cases occurred after the stock market fell -30% to -50%. This demonstrates how extreme the current selloff is. When panic sets in, the market can go lower in the short term, but the subsequent rally is also fierce. The more you stretch an elastic band in one way, the harder it bounces back in the other direction.
Speaking of elastic bands…
Standard Deviations
Finance sector
What makes this -17% decline so different from other -17% declines?
The fact the cyclical sectors are significantly underperforming while counter-cyclical sectors are outperforming. As Stan Druckenmiller said, this is not necessarily a long term bearish sign for stocks, but it is a long term warning sign (i.e. some long term bearish, a few false alarms).
XLF (finance sector ETF) has tanked this year.
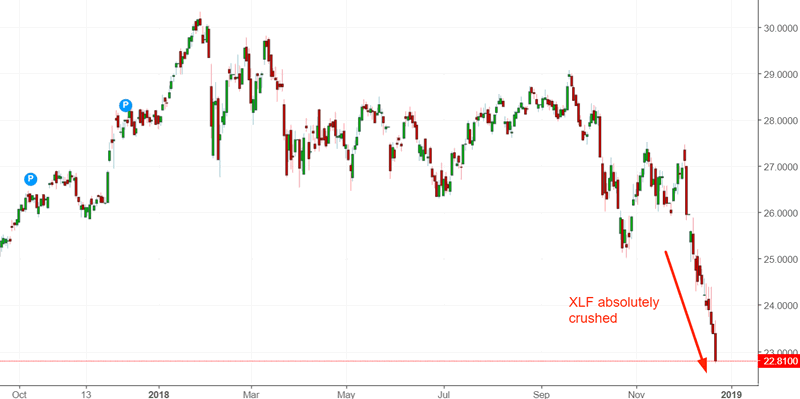
On a year-over-year basis, XLF is down more than -17% while the S&P is down less than -11%.
Here’s every similar case, from 1998 – present

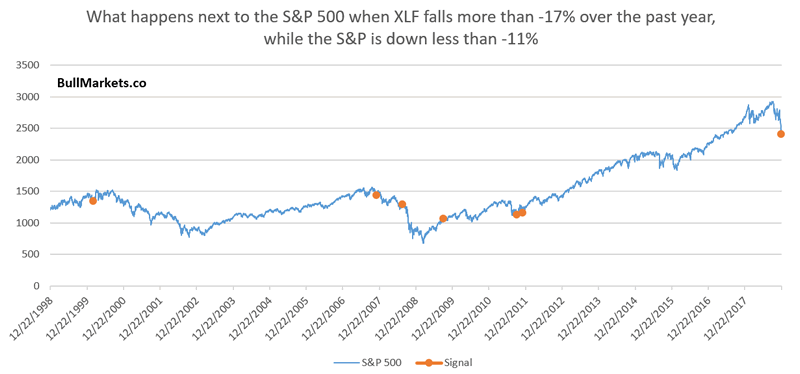
As you can see, a few long term bearish signs, but also some false alarms. But more importantly, even in a worst case scenario, the stock market makes a bear market rally. In a best case scenario, this is just a big 15-20% correction, and then new highs.
Banks
Defensive sectors
One of the problems I have continuously discussed about the current decline is how much utilities (defensive sectors) have outperformed. This is not a definitively long term bearish sign, but it certainly is a long term warning sign.
XLU (utilities ETF) is positive over the past year (252 trading days), while the S&P is down more than -10%.
Here’s every time this happened from 1998 – present.

2 long term bearish signs, 1 long term bullish sign.
Short Term
Apple
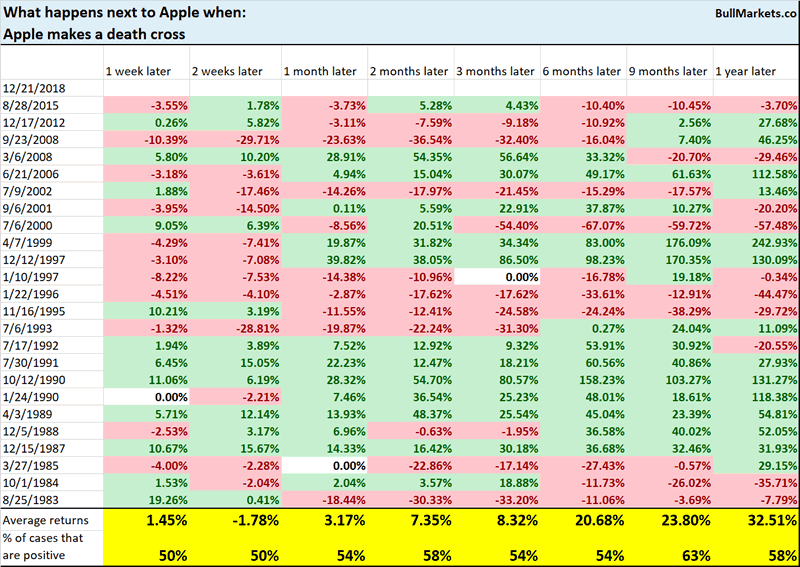
Apple has made a death cross.
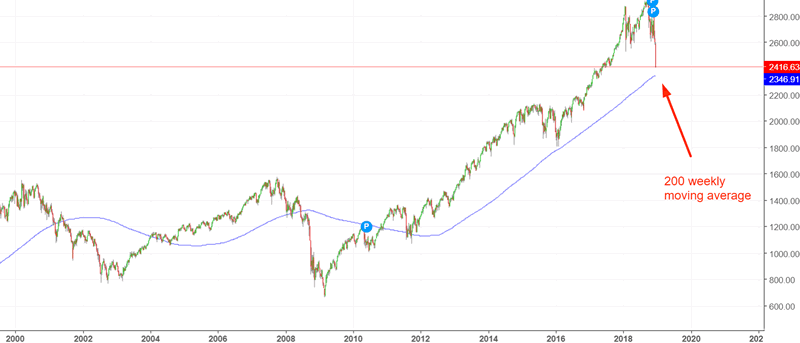
The 200 weekly moving average
The 200 weekly moving average is currently at 2350. This is exactly 20% below the September 2018 high.
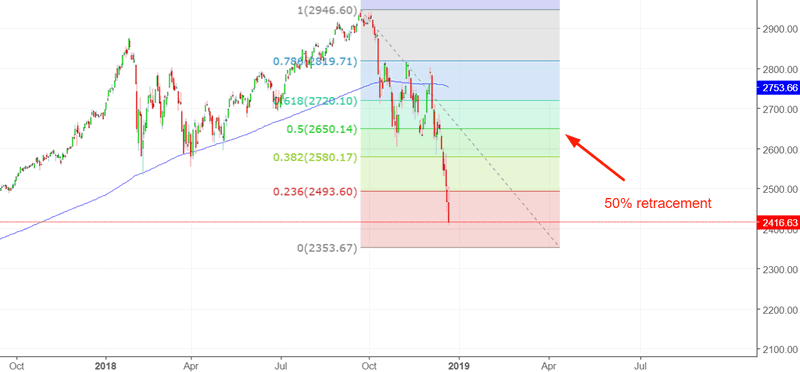
As I wrote on Wednesday, if this is the start of a much bigger 30-50% decline, the S&P tends to fall -15% to -20% (in some cases -23%) before making a 50% retracement. A 50% retracement brings the S&P back to 2650.
Click here for yesterday’s market studies
Conclusion
Here is our discretionary market outlook:
- For the first time since 2009, the U.S. stock market’s long term risk:reward is no longer bullish. This doesn’t necessarily mean that the bull market is over. We’re merely talking about long term risk:reward.
- The medium term direction is still bullish (i.e. trend for the next 6 months). However, if this is the start of a bear market, bear market rallies typically last 3 months. They are shorter in duration.
- The short term is a 50/50 bet
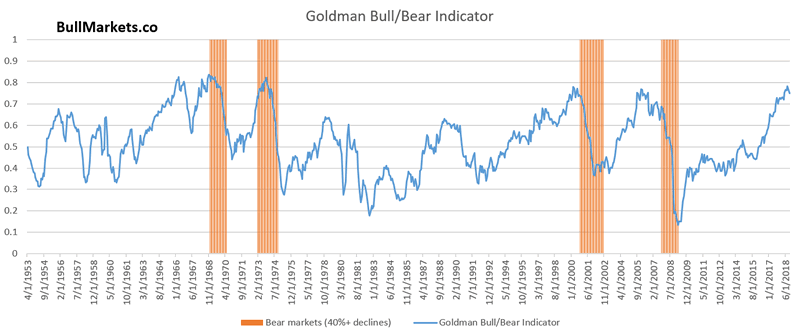
Goldman Sachs’ Bull/Bear Indicator demonstrates that while the bull market’s top isn’t necessarily in, risk:reward does favor long term bears.
Our discretionary outlook is not a reflection of how we’re trading the markets right now. We trade based on our clear, quantitative trading models, such as the Medium-Long Term Model.
Members can see exactly how we’re trading the U.S. stock market right now based on our trading models.
Click here for more market studies
By Troy Bombardia
I’m Troy Bombardia, the author behind BullMarkets.co. I used to run a hedge fund, but closed it due to a major health scare. I am now enjoying life and simply investing/trading my own account. I focus on long term performance and ignore short term performance.
Copyright 2018 © Troy Bombardia - All Rights Reserved
Disclaimer: The above is a matter of opinion provided for general information purposes only and is not intended as investment advice. Information and analysis above are derived from sources and utilising methods believed to be reliable, but we cannot accept responsibility for any losses you may incur as a result of this analysis. Individuals should consult with their personal financial advisors.
© 2005-2022 http://www.MarketOracle.co.uk - The Market Oracle is a FREE Daily Financial Markets Analysis & Forecasting online publication.


