


The S&P 500 is Now Wown -15%. What’s Next for Stocks
Stock-Markets / Stock Markets 2018 Dec 20, 2018 - 10:02 AM GMTBy: Troy_Bombardia

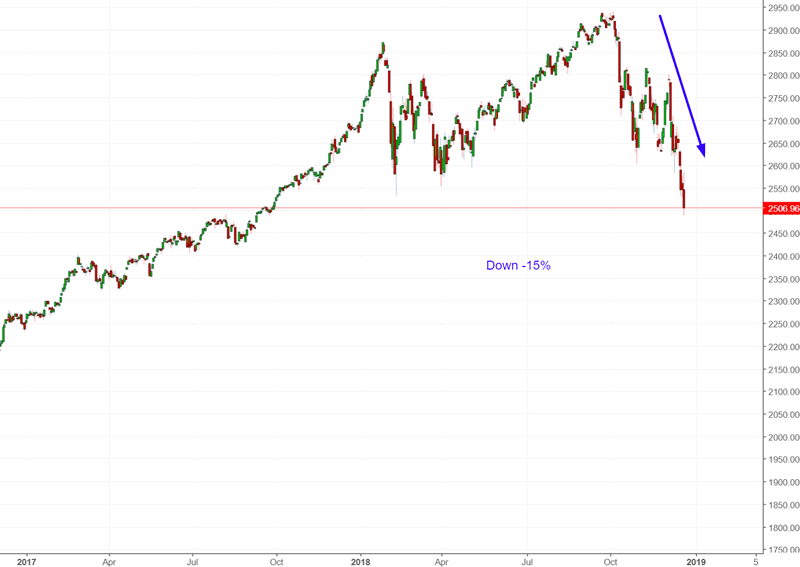
The S&P 500 is now down approximately -15%
Go here to understand our fundamentals-driven long term outlook.
Let’s determine the stock market’s most probable medium term direction by objectively quantifying technical analysis. For reference, here’s the random probability of the U.S. stock market going up on any given day, week, or month.

*Probability ≠ certainty. Past performance ≠ future performance. But if you don’t use the past as a guide, you are walking blindly into the future.
How bear markets start
If this is just a -15% or -20% decline, then you would obviously want to be a buyer here. Downside risk is approximately -5%, and the upside is much higher. Think risk:reward
But what you are afraid of is “is this the start of a -30% to -50% decline?” If the stock market tanks -30% and you buy here, your long position will get killed.
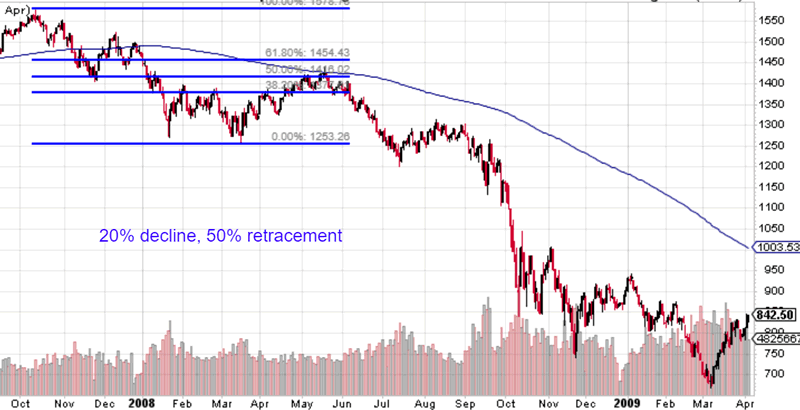
Let’s take a look at the previous 30%+ declines that lasted at least 1 year.
Here’s the 2007-2009 bear market. The S&P fell 20%, and then made a >50% retracement rally
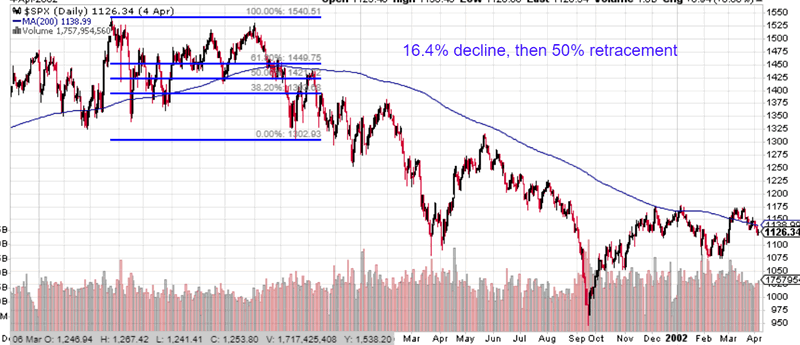
Here’s the 2000 – 2002 bear market. The S&P fell 16.4%, and then made a 50% retracement rally.
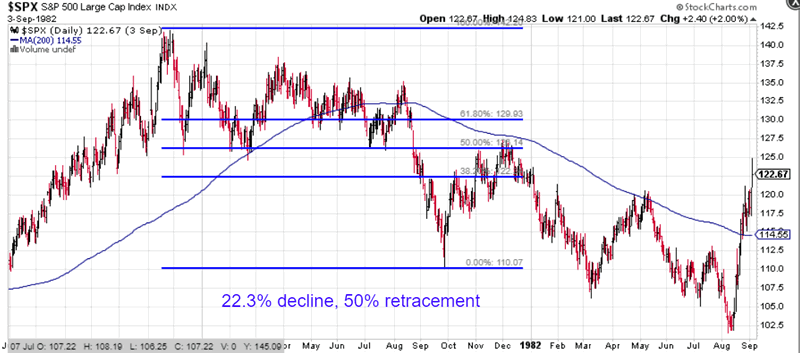
Here’s the 1981 – 1982 decline. The S&P fell 22.3%, and then made a 50% retracement
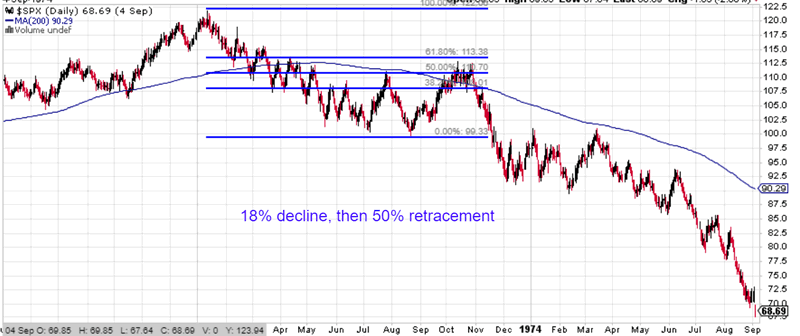
Here’s the 1973 – 1974 bear market. The S&P fell 18%, and then made a 50% retracement rally.
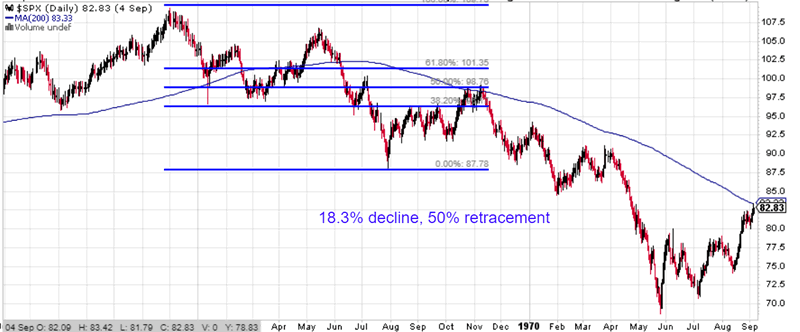
Here’s the 1969-1970 bear market. The S&P fell 18.3%, and then made a 50% retracement rally.
So what do you see?
If this is indeed the start of a 30-50% decline, then the stock market tends to make a big 50% retracement rally after the S&P falls -15% to -25%
The S&P is currently down -15%
Know which side risk:reward supports
Members can see exactly how we’re trading the U.S. stock market right now based on our trading models.
Mean reversion
The S&P 500 is now down more than -15% over the past 3 months, while within 25% of a 2 year high.
Historically, the stock market’s forward returns when this happened were random, with a slight bearish lean over the next 1 week. Why?
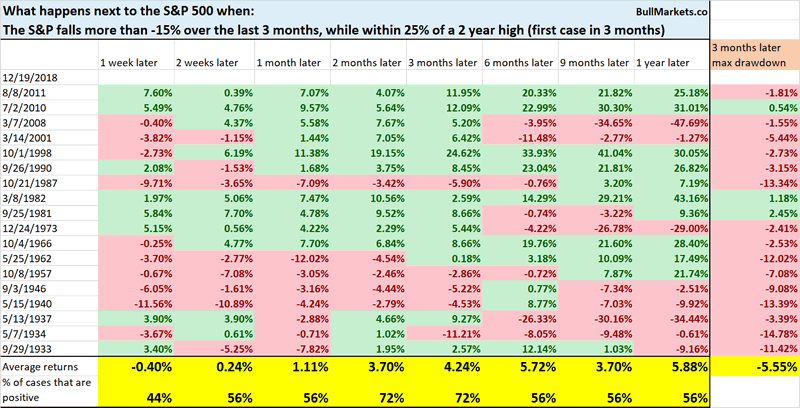
Because the rally might last 1 month, 2 months, 3 months, or God-knows how many months. TIME is not the important factor here. Magnitude is the important factor, and the mean-reversion bounce typically retraces 50%.
Terrible December
This has been one of the worst Decembers over the past 100 years. The S&P is down -9.8%, which is unusual because December is seasonally bullish. (As I have said in the past, seasonality works until it doesn’t. Seasonality factors are of secondary importance.)
Here’s what happened next to the S&P when it fell at least -9.8% in December (December’s LOW vs. November’s CLOSE)
*Data from 1900 – present
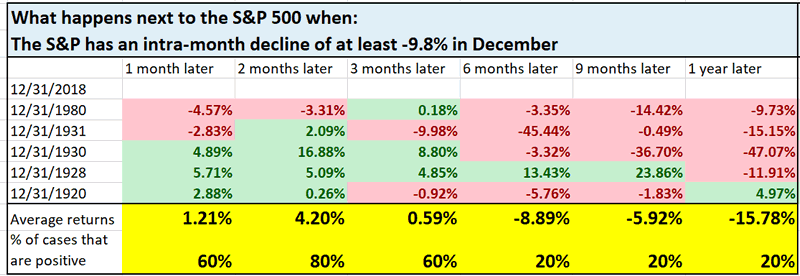
As you can see, the stock market typically makes a 1-3 month rally (standard time for a bear market rally), and then it goes down.
Interesting VIX
VIX has been extremely interesting during the course of the S&P’s -15% decline. VIX is flat, while the S&P is down much more.
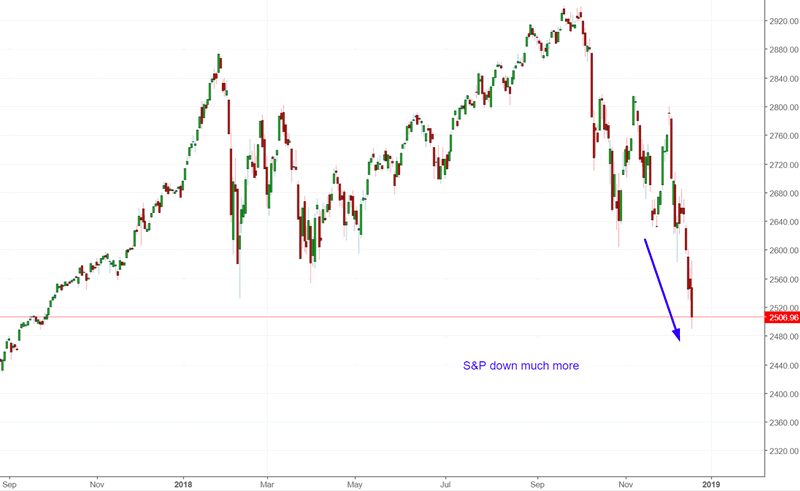
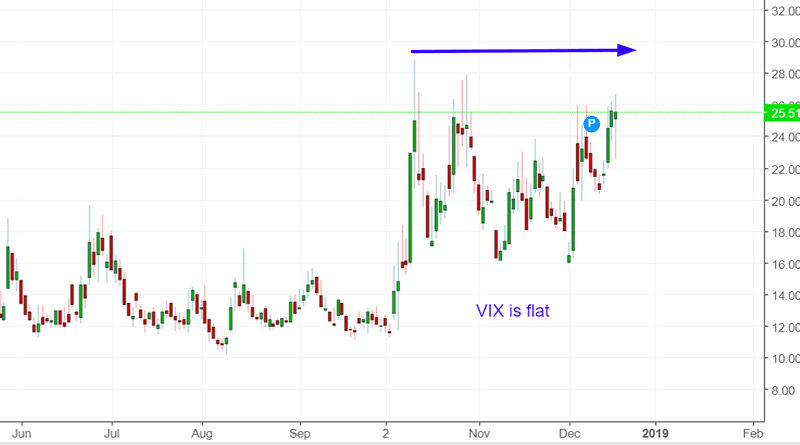
But here’s a more interesting point. VIX was completely flat today while the S&P tanked -1.5%. Is this a bullish sign for stocks?
Here’s what happened next to the S&P when the S&P fell more than -1.5%, while VIX was flat/down
*Data from 1990 – present
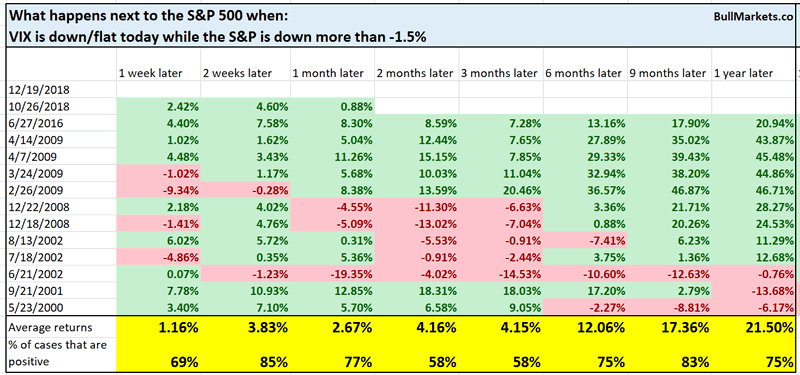
Note that even in bear markets, the S&P tends to rally 2 weeks later.
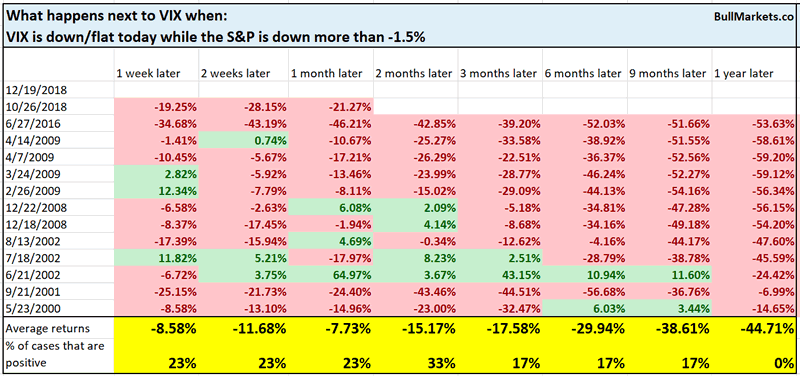
Here’s what happened next to VIX when the S&P fell more than -1.5%, while VIX was flat/down
Russell
Small cap stocks are down the most during the S&P’s -15% decline. The Russell 2000 index (small caps) are now down -20%
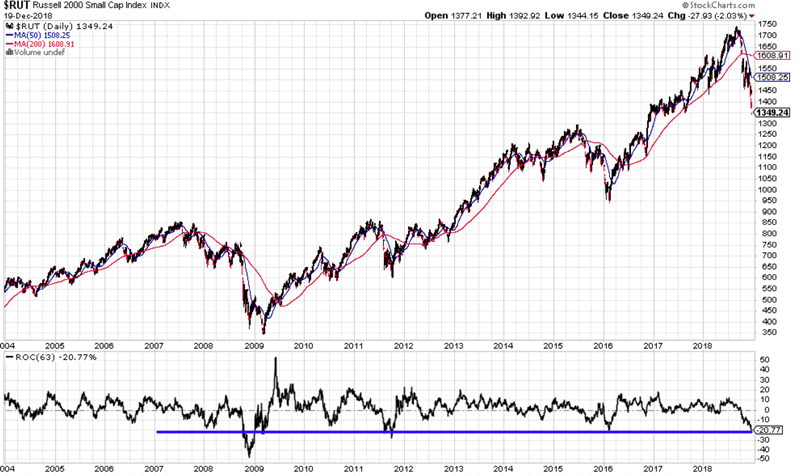
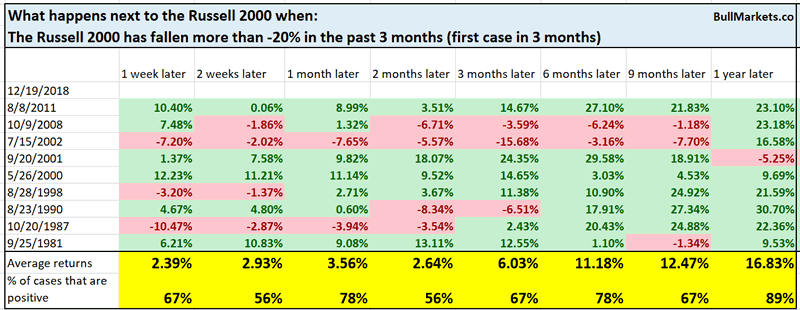
Here’s what happened next to the Russell when it fell more than -20% in the past 3 months.
*Data from 1980 – present
Here’s what happened next to the S&P 500 when the Russell fell more than -20% in the past 3 months.
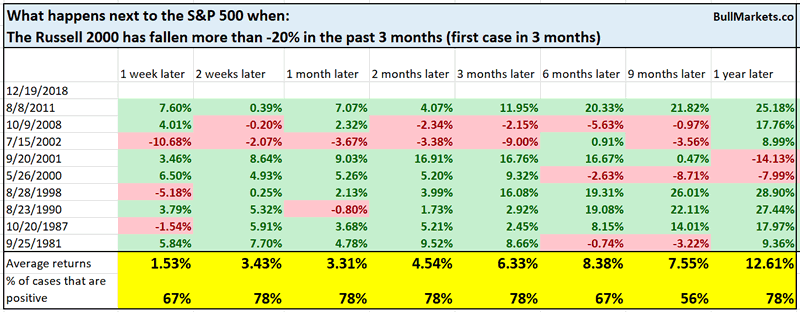
As you can see, the stock market tends to bounce over the next 1 month.
Dow’s death cross
Lost in the stock market’s recent decline is the fact that the Dow has made a “death cross”, whereby its 50 day moving average fell below its 200 day moving average.
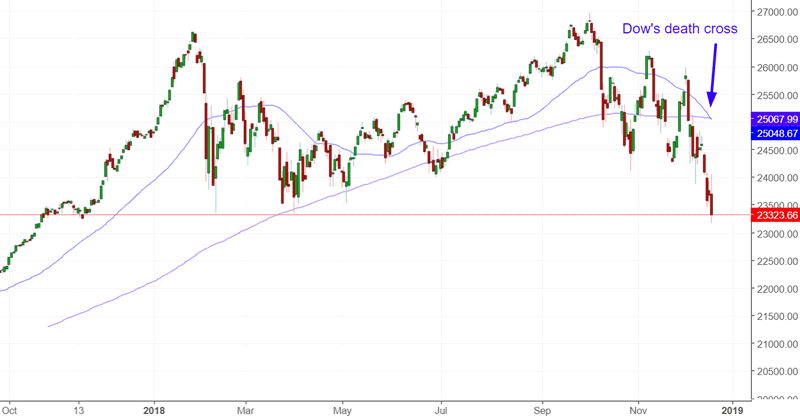
Here’s every single death cross for the Dow from 1900 – present, and what the Dow did next
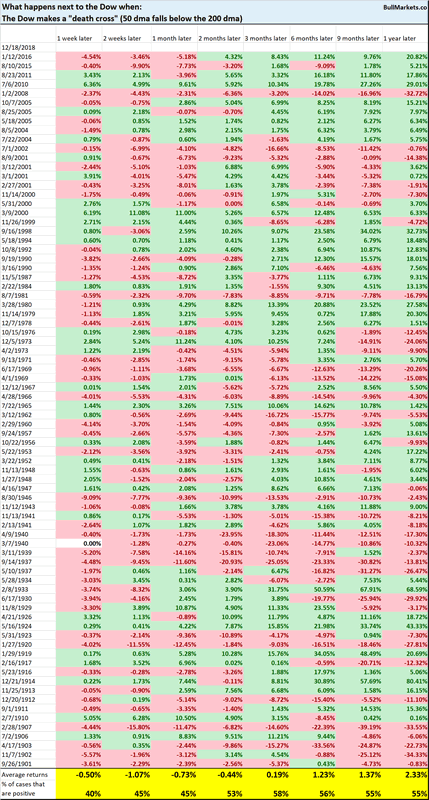
Historically, when the Dow made a death cross, it had a slight bearish lean over the next 1 month, after which forward returns were no different from random.
Click here for yesterday’s market studies
Conclusion
Here is our discretionary market outlook:
- For the first time since 2009, the U.S. stock market’s long term risk:reward is no longer bullish. This doesn’t necessarily mean that the bull market is over. We’re merely talking about long term risk:reward.
- The medium term direction is still bullish (i.e. trend for the next 6 months). However, if this is the start of a bear market, bear market rallies typically last 3 months. They are shorter in duration.
- The short term is a 50/50 bet
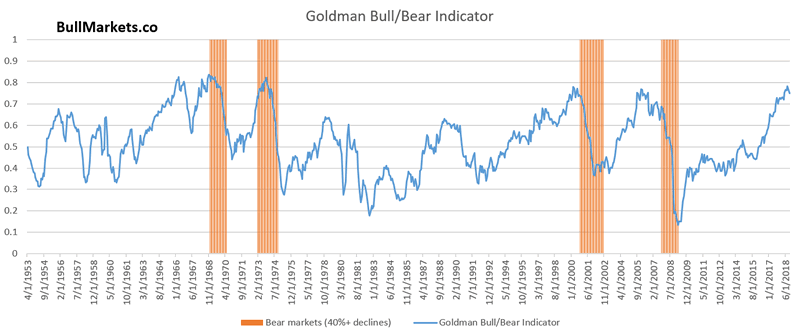
Goldman Sachs’ Bull/Bear Indicator demonstrates that while the bull market’s top isn’t necessarily in, risk:reward does favor long term bears.
Our discretionary outlook is not a reflection of how we’re trading the markets right now. We trade based on our quantitative trading models, such as the Medium-Long Term Model.
Members can see exactly how we’re trading the U.S. stock market right now based on our trading models.
Click here for more market studies
By Troy Bombardia
I’m Troy Bombardia, the author behind BullMarkets.co. I used to run a hedge fund, but closed it due to a major health scare. I am now enjoying life and simply investing/trading my own account. I focus on long term performance and ignore short term performance.
Copyright 2018 © Troy Bombardia - All Rights Reserved
Disclaimer: The above is a matter of opinion provided for general information purposes only and is not intended as investment advice. Information and analysis above are derived from sources and utilising methods believed to be reliable, but we cannot accept responsibility for any losses you may incur as a result of this analysis. Individuals should consult with their personal financial advisors.
© 2005-2022 http://www.MarketOracle.co.uk - The Market Oracle is a FREE Daily Financial Markets Analysis & Forecasting online publication.