Stock Market Topping Formation as Risks Rise Around the World
Stock-Markets / Financial Crisis 2018 Dec 11, 2018 - 04:17 PM GMTBy: FXCOT
 Brexit Woes
British Prime Minister Theresa May delayed a critical parliamentary vote on her proposal to leave the European Union, throwing both her government and her plans for the U.K.’s exit from the bloc into disarray. The big problem in brexit is ireland. Ireland is a EU member. Post Brexit, EU argues, that Ireland will be subject to EU rules while UK seeks assurances from them that a last-resort “backstop” guarantee that ensures no hard border appears between the Republic of Ireland and British-ruled Northern Ireland. But securing such a concession will be a challenge. So we are clearly moving towards a hard brexit and GBPUSD will fall from the current levels of 1.25. One of the best ways to take advantage of the brexit is via trading the GBPUSD via trade copier at fxcot.com
Yield curve inversion
The yield spread between 10-year and two-year U.S. Treasuries stood at 0.129 percentage points, putting the long-dated bond dangerously close to inverting, which would be a signal of a recession, analysts said.
SPX: Our base case is for 2920 in Q1 2019
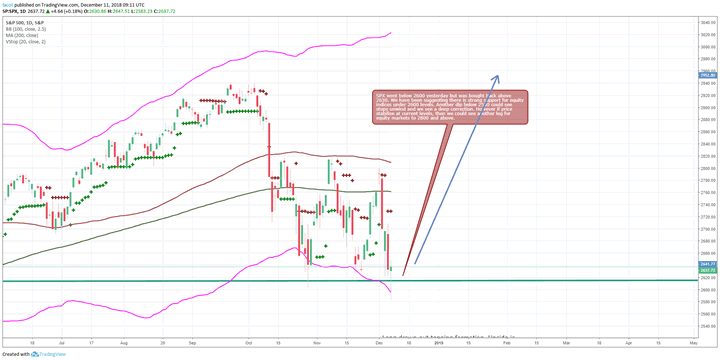
While the economy slows and political risks are on the rise, markets often do not react immediately to these risks. We do believe that price action on SPX in last 6 months has been suggestive of a reluctance to break down. Support at 2550 has held all through the year. Companies are just about meeting their expectations. If prices hold 2550 on SPX, we see another legup in equity markets.

Investors also have been closely watching the bond market for clues on the health of the economy, with one section of the widely watched yield curve—the difference between two-year and five-year Treasury yields—inverting last week. The measure has historically been an accurate predictor of U.S. recessions, with an inverted yield curve preceding every economic downturn since the 1950s. In another sign of fear, near-term futures contracts tied to the VIX have jumped above those expiring in later months—a signal that investors are bracing for extreme swings in the next couple of weeks. The Cboe Volatility Index, known as VIX, fell to 22.64, snapping a three-session streak of gains. The measure earlier climbed as high as 25.94, putting it on track to surpass a closing high reached in October. The VIX also closed above the level of 15 for the 44th day in a row, continuing its longest such stretch since March 2016. The streak indicates investors are increasingly preoccupied with broader risks in the equity market and less inclined to use selloffs as opportunities to load up on more shares. However while VIX has stayed above 20 levels for a record 44th day, we still have not broken 2550 in a clear method. Also VIX has still not run away despite the heightened risks across the world.
GBPUSD: Daily downtrend is well established
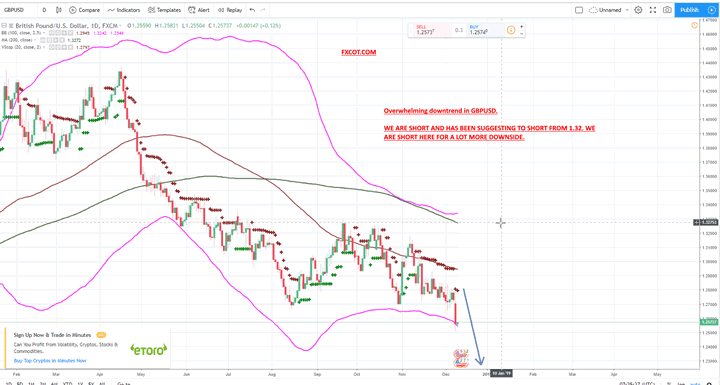
GBPUSD Hourly
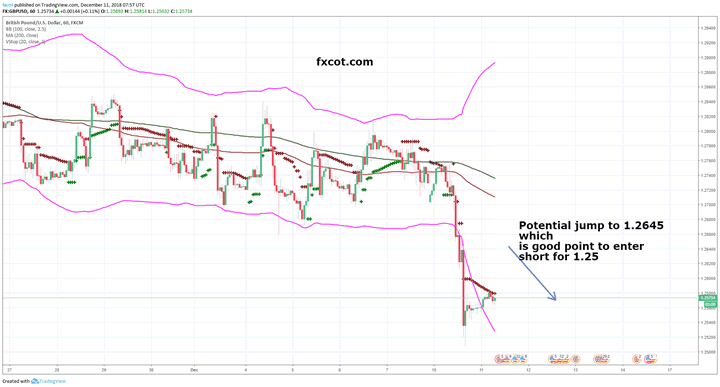
The hourly charts show there is a minor possibility of a bounce to 1.2645. That is a good chance to short. As we move closer to a no deal brexit, GBPUSD has a lot more downside. Our view is we will break 1.2 soon.
EURUSD Hourly
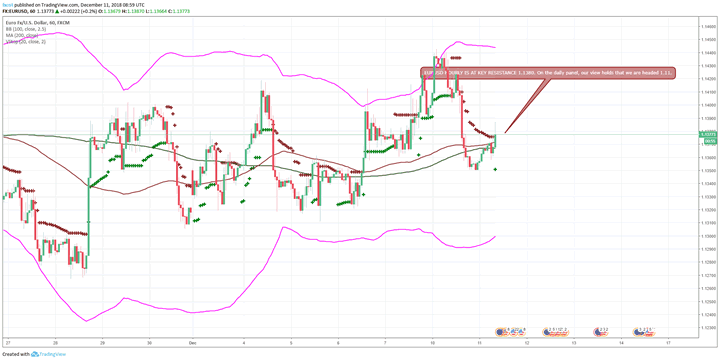
The hourly chart on EURUSD is at key resistance at 1.1380.
EURUSD Daily
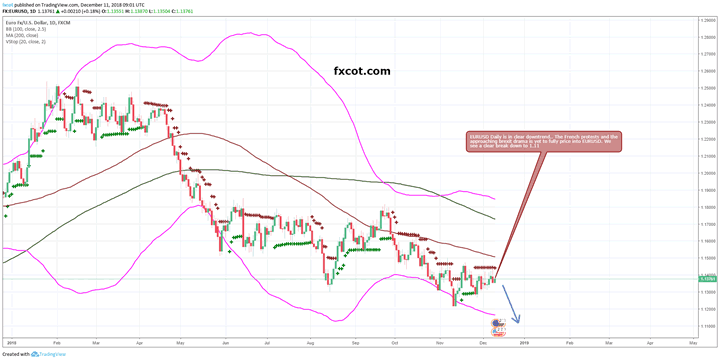
The daily chart show the clear downtrend on EURUSD. It is best traded with our trade copier which is fully automated trend system and is able to both scalp and play the big trends. The system has turned 20,000 into 16 million in just 8 years. You can therefore catch these trends and make huge money via the automated system rather than guess work. Reach out here
USDJPY Daily
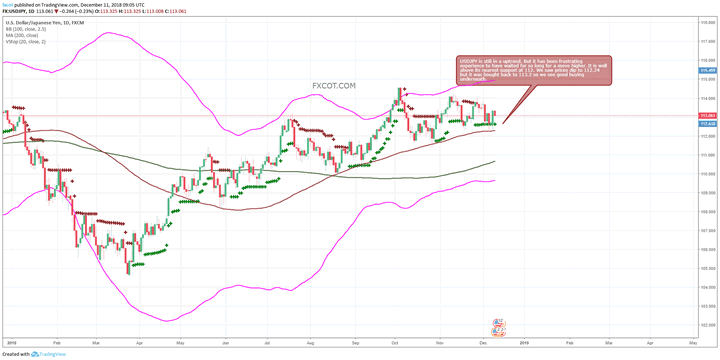
USDJPY is still in a uptrend. But it has been frustrating experience to have waited for so long for a move higher. It is well above its nearest support at 112. We saw prices dip to 112.24 but it was bought back to 113.2 so we see good buying underneath.
Key economic indicators around the world are worsening One of the key reason why we believe that equity markets have limited upside and it has been our call from earlier, is that economic indicators in US, EU, UK, China, Japan and India are all faltering at the same time. Tariff based industries are the most suspect but also auto and manufacturing are suffering.
Machine orders in Japan fall dramatically
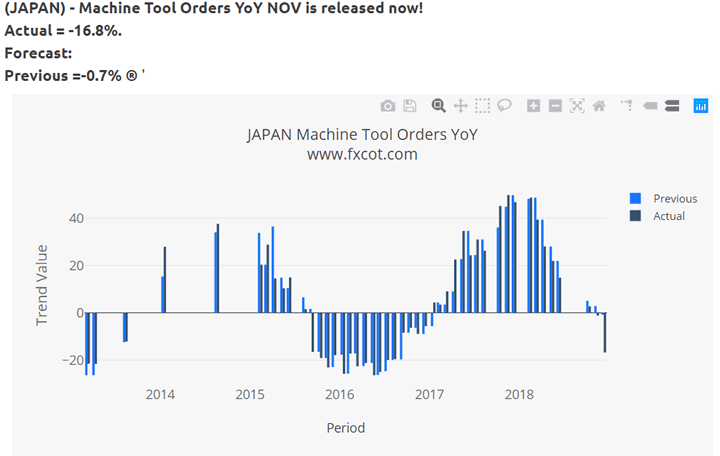
The current actual data at -16.8% is lower than the previous release at -0.7. The mean for " Machine Tool Orders YoY " over the last 46 releases is 5.5
Japan GDP worse than expected
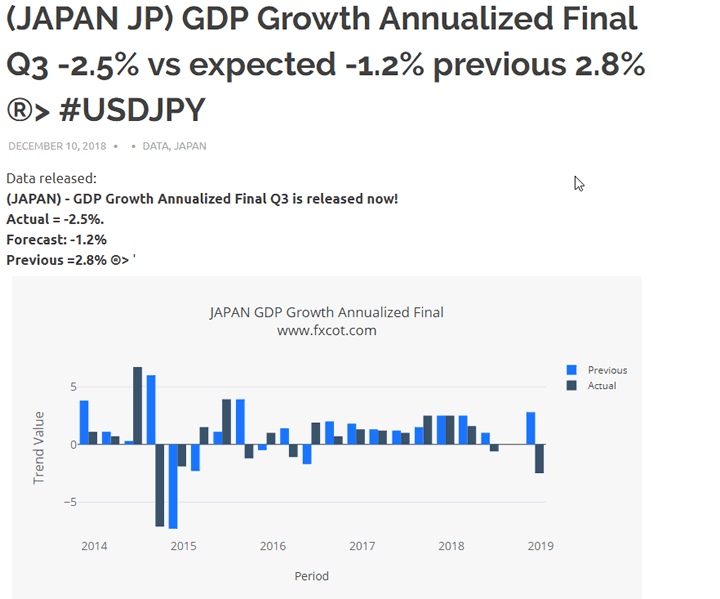
The GDP at -2.5% is lower than the previous release at 2.8% in december 2017. The mean for " GDP Growth Annualized Final " over the last 20 releases is 0.7%.
US : NFP is weakening
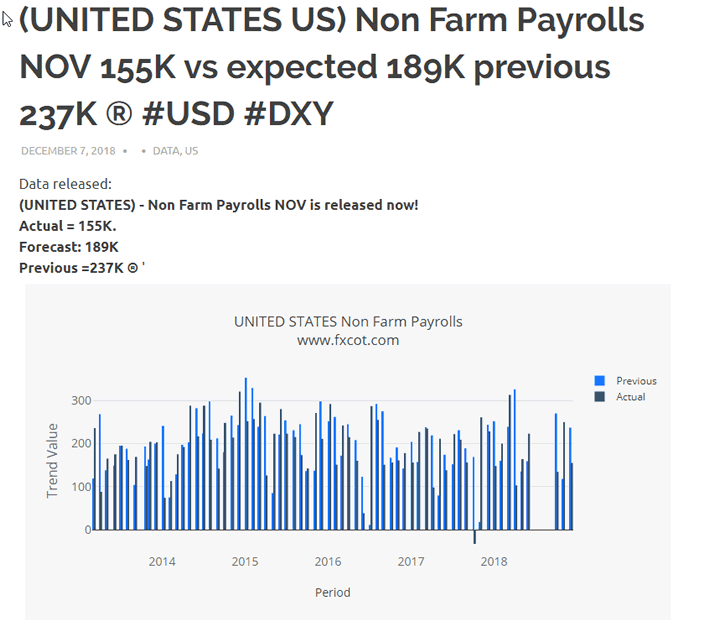
As the FED raises rates, US jobs report has been weakening. The mean for " Non Farm Payrolls " over the last 68 releases is 194.0. The current actual data is lower than the mean of the last 68 releases.
So while the risks for a slowdown and political storm take over across UK and EU, our trade copier has been doing brilliantly. Manual trading simply cannot match up to the results of a automated trading system like the FXCOT system. The FXCOT system is a pure forex trading system which has proven its trading ability since 2010. It has a win rate of 82% and has made 16 million dollar in profit since 2010. Exceptional trading capabilities. Take manual guess work out of your trading and align yourself with the latest trends. FXCOT is a research based and data and analytic driven trading system as you can observe the tracking of all economic activity.
So this is one of the best trading systems operational in the world today. All clients including US clients can join us and take advantage of our trades. Every single year, has made over +100%.
You can find out more about how to start with us by contacting us here
Teamcot
FXCOT is Investment Management firm specializing in futures and forex trading. We run a high return trading system for our premier clients. The trading systems uses four different strategies to take advantage of various market conditions. We also send daily trade setups and economic commentary.
© 2018 Copyright FXCOT - All Rights Reserved Disclaimer: The above is a matter of opinion provided for general information purposes only and is not intended as investment advice. Information and analysis above are derived from sources and utilising methods believed to be reliable, but we cannot accept responsibility for any losses you may incur as a result of this analysis. Individuals should consult with their personal financial advisors.
© 2005-2022 http://www.MarketOracle.co.uk - The Market Oracle is a FREE Daily Financial Markets Analysis & Forecasting online publication.


