


Silver Fails Miserably To Meet Expectations
Stock-Markets / Stock Markets 2018 Dec 10, 2018 - 03:19 PM GMTBy: Kelsey_Williams

 No matter how harsh it sounds, it is true. Unfortunately, too many people don’t want to hear it and refuse to listen.
Acknowledgement of the facts doesn’t seem to deter its supporters. We are told that silver’s ongoing underperformance relative to gold makes it “a better buy” with “more profit potential”.
Let’s see what the charts say.
Silver Prices – 100 Year Historical Chart
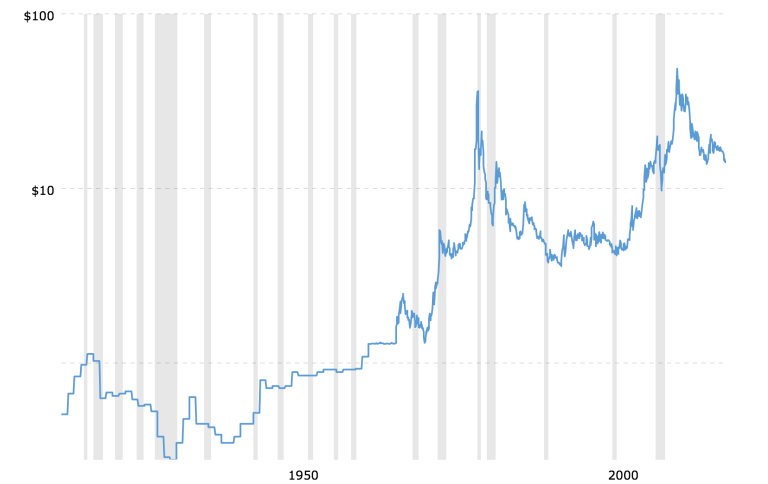
(source)
Silver is currently at $14.41. From a low price point of $1.31 per ounce in October 1971, silver’s price today is up 1000 percent over the past forty-seven years. That is an annualized gain of 5.21%.
However, on an inflation-adjusted basis, that number is a woefully low 1.23%. Certainly not the kind of return that supports the wild claims and projections that we hear continually about the prospects for silver.
But wait a minute. What should we be expecting, anyway? An inflation-adjusted return of anything more than zero means that silver has at least matched the decline in purchasing power of the U.S. dollar. Isn’t that enough?
Apparently not. Especially, if you bought it after January 1980. Below is the same 100-year price history of silver on an inflation-adjusted basis.
Silver Prices – 100 Year Historical Chart (inflation-adjusted)
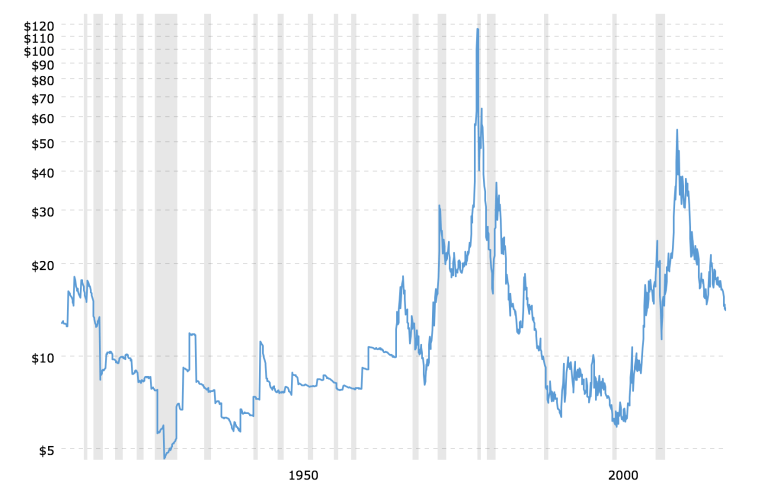
The 1980 peak and subsequent decline is horrendous. And the decade-long move upwards to its 2011 peak, followed by its subsequent decline over the past seven years, tell us much more than the current analysis we hear from some experts.
As bad as the activity pictured is (and it is bad), it is actually worse. In inflation-adjusted terms, silver today is actually lower than it was in February 1973.
That net effect is that if you had bought silver in the very early stages of its real-money, supply/demand, free-market, five-decade long advance in price, you are still a net loser.
So how does silver compare to gold? Over the same time period, gold’s inflation-adjusted value increased five-fold. That equates to a 400 percent total gain for gold versus a small net loss for silver.
In order for silver to match gold’s price gains over the past forty-five years it would need to be $72.00 per ounce today – not $14.41.
Since their simultaneous price peaks in January 1980, gold is fifty-eight percent higher and silver is sixty-six percent lower.
The US dollar has lost more than ninety-eight percent of its purchasing power since 1913. In other words, it takes more than fifty times as many paper dollars today to purchase comparable amounts of similar goods and services you could have purchased in 1913. The sixty-fold increase ($1237.00 divided by $20.67) in gold’s U.S. dollar price compensates quite well for the decline in U.S. dollar purchasing power. The eleven-fold increase $14.41 divided by $1.29) in silver’s U.S. dollar price clearly does not.
Silver’s use as money is well-documented historically. I get that. But it is still primarily an industrial commodity. And neither of these uses (singly or combined) makes silver special enough to warrant the exaggerated claims of those who expect to alter the patterns of history.
The much talked about gap in consumption over production, the gold-to-silver ratio, JP Morgan Chase’s accumulation of silver bullion – none of these things merit the attention they receive insofar as they pertain to “fundamentals” for silver.
They are misunderstood and over-emphasized as justification for price projections of dubious nature.
Clearly, though, the biggest risk factor regarding analysis for silver and projections for its price is unrealistic expectations. Those expectations have their roots in the price activity generated between 1971-80.
There are two primary reasons for silver’s price surge in the 1970s:
- Silver mining production lagged consumption for nearly two full decades during the 1950s and 60s. During that period, the U.S. Treasury sold silver regularly from its hoard of nearly two billion ounces. This action kept the market price for silver suppressed. By 1970 nearly all of the silver was gone and the Treasury had to stop its sales. Thus, the price of silver was freed to find a presumably higher level that would eventually balance consumption and production.
- The United States suspended all convertibility of the U.S. dollar into gold in 1971. Those who were prescient enough to recognize the ongoing threat of further U.S. dollar depreciation, purchased gold and silver based on their historic roles as money.
These two forces and sent silver prices far beyond any reasonably sustainable level at the time. (From an average price of $1.60 to a high of $49.50 in January 1980 represents a three thousand percent increase.)
What happened for silver in 1971-80 was a confluence of events which is not likely to happen again. At least not anytime soon. Furthermore, it served as a catch-up period, during which silver prices sought a higher level which was more in accordance with traditional laws of supply and demand.
This is because for one hundred years previously, the silver market was subjected to intervention by government involving price supports and price suppression. And the underlying motivation for government’s action was political.
Unfortunately, far too many people are still expecting a repeat of 1971-80. And they will continue to be disappointed. Even silver’s price explosion from 1999 – 2011 only took it to about one-half of its 1980 peak in inflation-adjusted terms (see chart above).
For now, suffice it to say, that nothing has changed which warrants the outlandish predictions that abound regarding silver.
(also see No Silver Lining Here)
Kelsey Williams is the author of two books: INFLATION, WHAT IT IS, WHAT IT ISN’T, AND WHO’S RESPONSIBLE FOR IT and ALL HAIL THE FED!
By Kelsey Williams
http://www.kelseywilliamsgold.com
Kelsey Williams is a retired financial professional living in Southern Utah. His website, Kelsey’s Gold Facts, contains self-authored articles written for the purpose of educating others about Gold within an historical context.
© 2018 Copyright Kelsey Williams - All Rights Reserved Disclaimer: The above is a matter of opinion provided for general information purposes only and is not intended as investment advice. Information and analysis above are derived from sources and utilising methods believed to be reliable, but we cannot accept responsibility for any losses you may incur as a result of this analysis. Individuals should consult with their personal financial advisors.
© 2005-2022 http://www.MarketOracle.co.uk - The Market Oracle is a FREE Daily Financial Markets Analysis & Forecasting online publication.