Why the Crude Oil Price Collapsed to $50
Commodities / Crude Oil Nov 28, 2018 - 04:54 PM GMTBy: Nadeem_Walayat
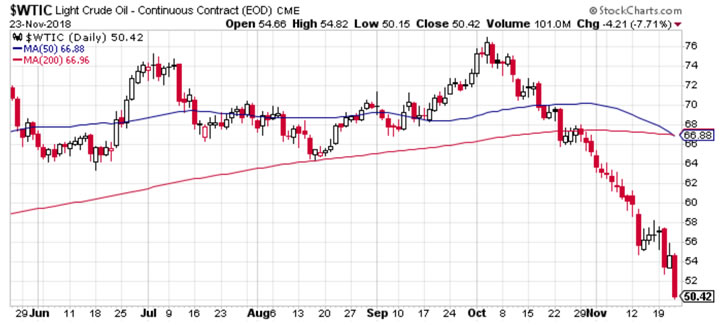
From a high of $77 barely 6 weeks ago the crude oil price has been on a relentless downwards slide, slicing through key support levels all the way to a new low for the year of just $50! A move that NO ONE saw coming! With the key triggering price point coming late October when the oil price failed to hold support at $64.

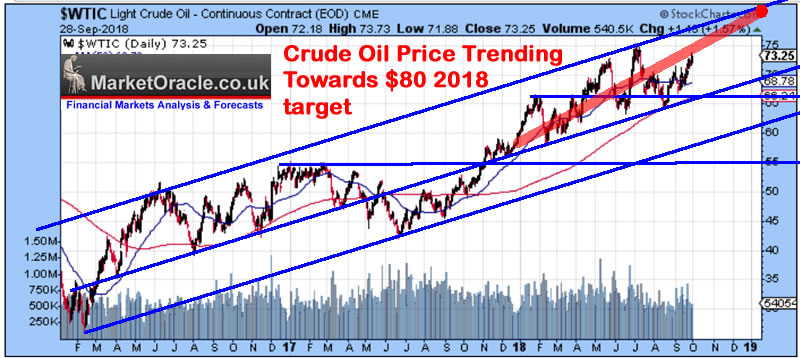
Firstly, a reminder of my forecast expectations for the year which were the for the oil price to target a trend to $80, that came within touching distance of achieving early October.
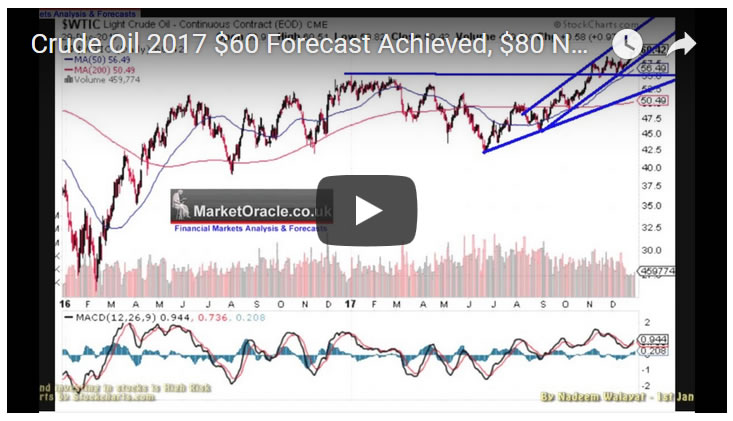
01 Jan 2018 - Crude Oil Achieves $60 Forecast Expectations for 2017, $80 Next?
Oil is clearly in a bull market and thus I expect the bullish trend to continue and would not be surprised if we see crude oil break above $80 during the year!
My update of late February reaffirmed the $80 target despite the then deep 15% drop.
27 Feb 2018 - Crude Oil Price Trend Forecast for March 2018
CONCLUSION
Therefore the crude oil price appears likely to remain within a trading range for the next month or so with-in the high of $67 and a low of $58. Thus given that the oil price is currently at $64 is near resistant then the oil price should soon reverse lower to target $58 which is likely to be the trend for most of March 2018 before the next assault on the high as my longer term 2018 forecast for a $80 crude oil price remains in tact.
With my last look at the oil price of late September concluding:
Therefore my forecast remains as at the start of the year that the crude oil price will target a trend to $80 which is not likely to be achieved during late December / early January 2019 as so far it is not showing any signs of wanting to breakdown into the lower end of its trend channel the consequences of which would be it would take a lot longer to get to $80.

So what happened to the oil price to turn a volatile bull market into a nose bleed drop bear market during October. Why did the oil price fail to hold support at $60 -$64, a clue being that the oil price is not behaving in a technically sound manner.
The rest of this analysis has first been made available to patrons who support my work.
For immediate First Access to ALL of my analysis and trend forecasts then do consider becoming a Patron by supporting my work for just $3 per month. https://www.patreon.com/Nadeem_Walayat.
Your analyst putting his money where his mouth is by buying the Dow at 24,285.
Nadeem Walayat
Copyright © 2005-2018 Marketoracle.co.uk (Market Oracle Ltd). All rights reserved.
Nadeem Walayat has over 30 years experience of trading derivatives, portfolio management and analysing the financial markets, including one of few who both anticipated and Beat the 1987 Crash. Nadeem's forward looking analysis focuses on UK inflation, economy, interest rates and housing market. He is the author of five ebook's in the The Inflation Mega-Trend and Stocks Stealth Bull Market series that can be downloaded for Free.
 Nadeem is the Editor of The Market Oracle, a FREE Daily Financial Markets Analysis & Forecasting online publication that presents in-depth analysis from over 1000 experienced analysts on a range of views of the probable direction of the financial markets, thus enabling our readers to arrive at an informed opinion on future market direction. http://www.marketoracle.co.uk
Disclaimer: The above is a matter of opinion provided for general information purposes only and is not intended as investment advice. Information and analysis above are derived from sources and utilising methods believed to be reliable, but we cannot accept responsibility for any trading losses you may incur as a result of this analysis. Individuals should consult with their personal financial advisors before engaging in any trading activities.
Nadeem Walayat Archive |
© 2005-2022 http://www.MarketOracle.co.uk - The Market Oracle is a FREE Daily Financial Markets Analysis & Forecasting online publication.


