


When Will the Stocks Bull Market End?
Stock-Markets / Stock Markets 2018 Nov 28, 2018 - 11:55 AM GMTBy: Troy_Bombardia

 As we approach the final month of this year, it’s worth reflecting on our thoughts and actions over the past year. Reflection is how you become a better investor and trader.
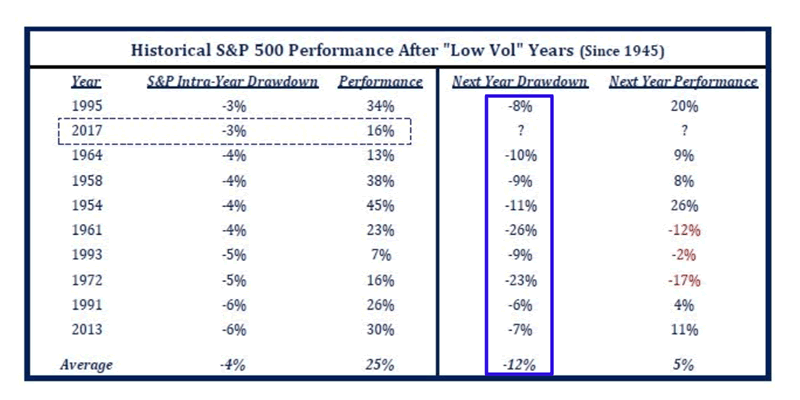
I posted the following chart in December 2017. Interesting how this year’s max drawdown is pretty much inline with the average drawdown of -12%
Let’s determine the stock market’s most probable direction by objectively quantifying technical analysis. For reference, here’s the random probability of the U.S. stock market going up on any given day, week, or month.

*Probability ≠ certainty.
Late-cycle behavior
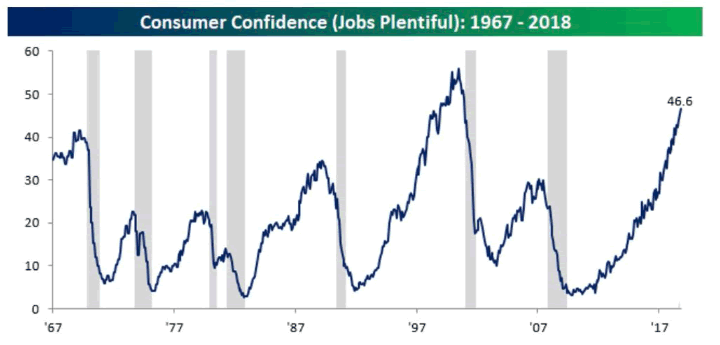
According to the Conference Board, a very high % of consumers are saying that jobs are “plentiful”. This mirrors the very low unemployment rate and tight labor market.
In other words, this is a sign of “as good as it gets” for the economy (and hence the stock market).
Here’s what happened next to the S&P 500 when the % of consumers saying “jobs are plentiful” exceeds 46%.
*Data from 1967 – present
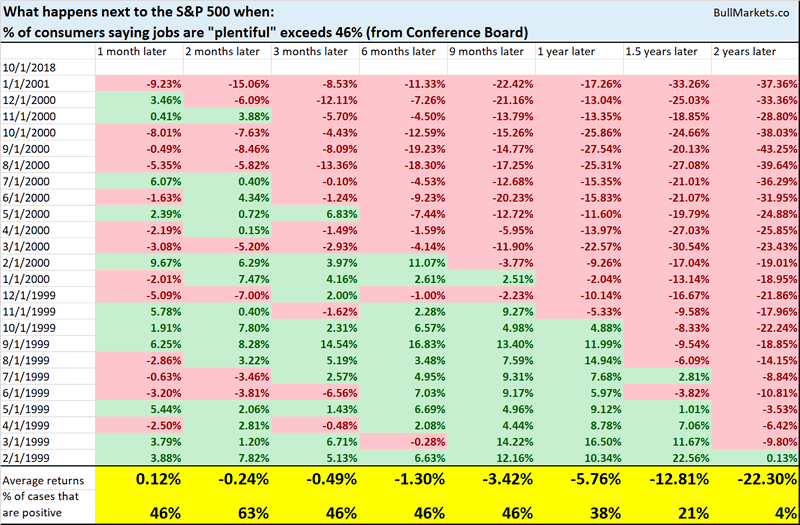
Notice how every single case is from February 1999 – January 2001. The first time this happened in the last cycle was February 1999, 1 year before the bull market topped. This suggests that the bull market has 1 year left, at most.
Sotheby’s
Sotheby’s shares have fallen a lot recently, down more than 1/3 from a 1 year high. Some people think Sotheby’s is a leading indicator for the stock market because high-end purchases are generally leading indicators.
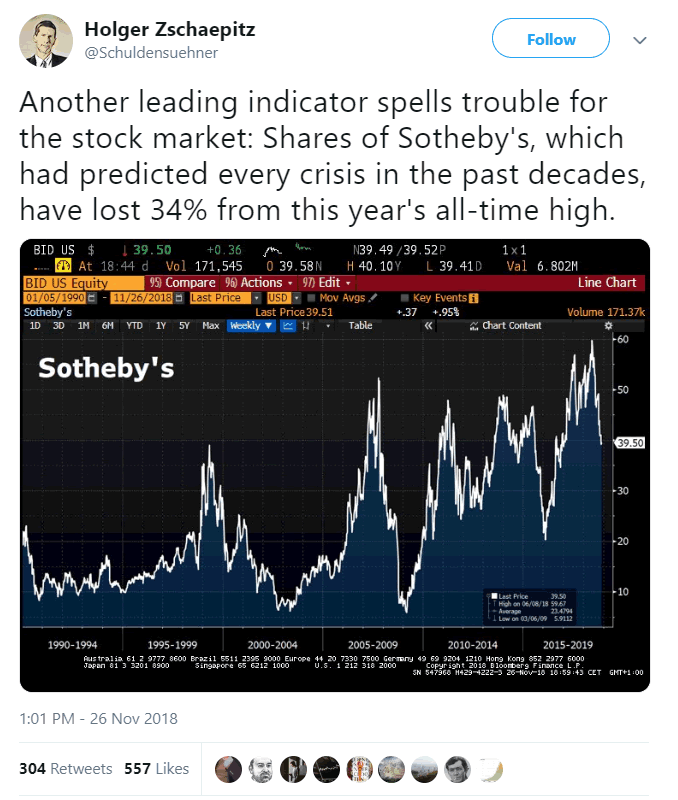
While it’s true that big-ticket economic indicators are leading indicators for the stock market and economy, using 1 stock to predict the whole stock market is silly, to say the least. It’s like the people who used IBM’s demise to predict the stock market’s demise from 2013 – present (clearly that didn’t work out for the permabears).
Here’s what happened next to the S&P 500 when Sotheby’s fell 1/3 from a 1 year high.
*Data from 1988 – present
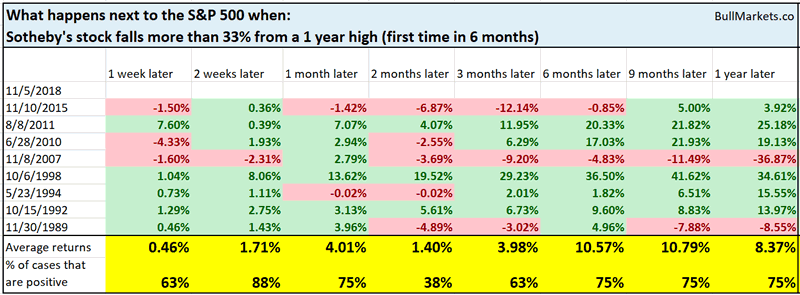
As you can see, this “leading indicator” has more false signals than useful signals. This is neither consistently bullish nor bearish for the stock market.
Big Monday’s
The S&P 500 rallied on Monday.
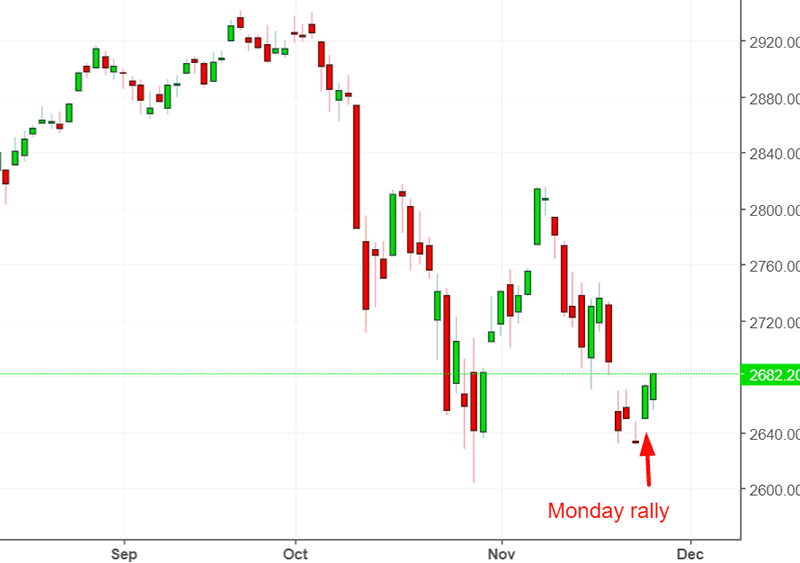
Jim Cramer, who has now turned long term bearish (after the stock market falls), has said “big Monday’s are typical of bear markets”.
Is he correct? Let’s look at the data.
These are the number of +1.5% Mondays each year. You can see that “a lot of big Monday’s” happened in many years, in bull markets and bear markets.
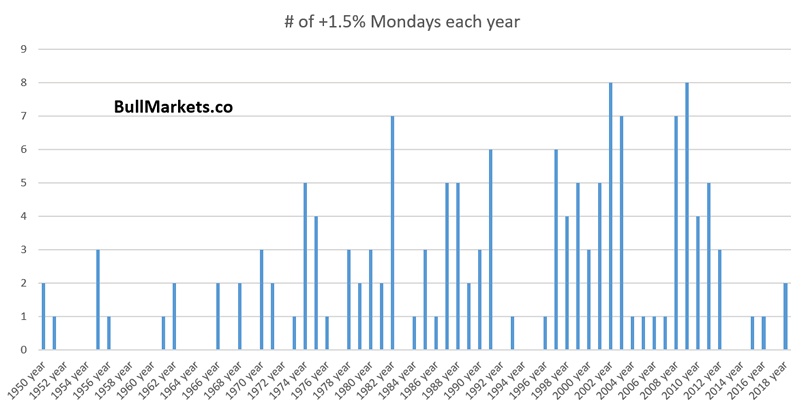
Sorry Jim. Overly simplistic analysis (e.g. Mondays, Tuesdays, Wednesdays, Thursdays…) is usually not very useful for predictive purposes.
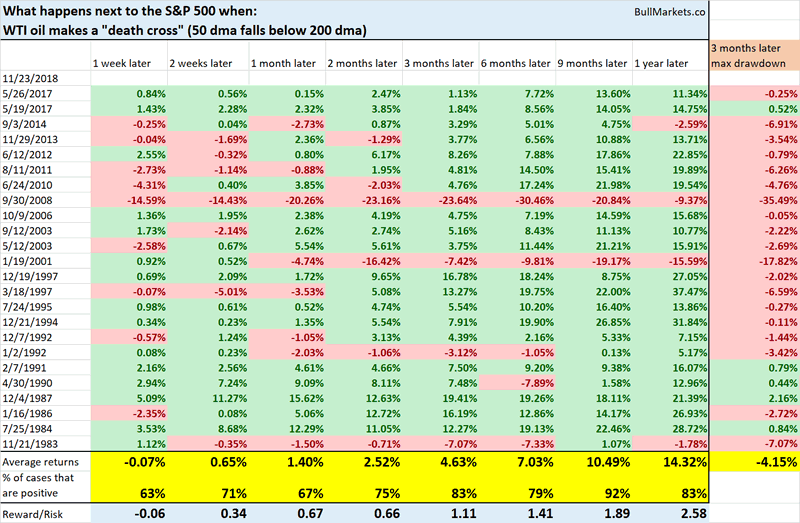
Oil’s death cross
Oil made a “death cross” recently, whereby its 50 day moving average fell below its 200 day moving average.
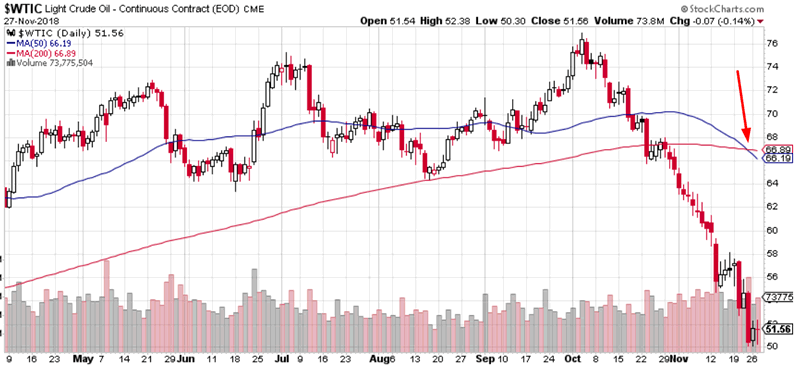
Here’s what happened next to the S&P 500 when oil makes a “death cross”
*Data from 1983 – present
Bitcoin’s crash
Bitcoin has been absolutely slaughtered. Its drawdown is now close to being on par with its biggest drawdowns in history.
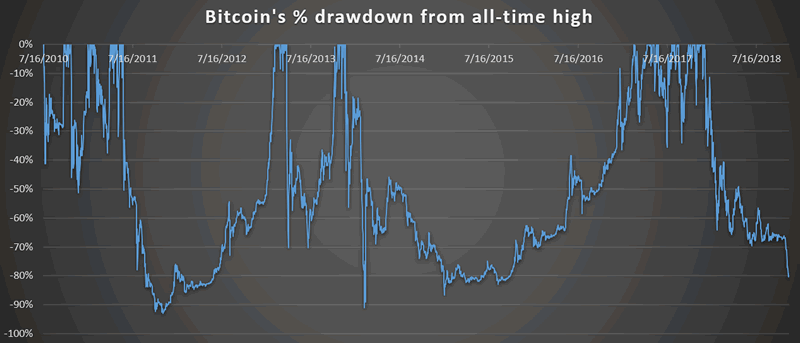
Does this mean that you should buy Bitcoin? I don’t know. But generally speaking, relying on historical market studies for markets with limited data is not a good idea. Bitcoin’s data is limited from 2010 – present
Click here to see yesterday’s market study
Conclusion
Our discretionary technical outlook remains the same:
- The current bull market will peak sometime in Q2 2019.
- The medium term remains bullish (i.e. approximately next half year).
- The short-medium term is mostly a 50-50 bet.
We focus on the medium term and long term. We mostly ignore the short term, which is usually just noise.
Our discretionary market outlook is not a reflection of how we’re trading the markets right now. We trade based on our clear, quantitative trading models, such as the Medium-Long Term Model.
Members can see exactly how we’re trading the U.S. stock market right now based on our trading models.
Click here for more market studies
By Troy Bombardia
I’m Troy Bombardia, the author behind BullMarkets.co. I used to run a hedge fund, but closed it due to a major health scare. I am now enjoying life and simply investing/trading my own account. I focus on long term performance and ignore short term performance.
Copyright 2018 © Troy Bombardia - All Rights Reserved
Disclaimer: The above is a matter of opinion provided for general information purposes only and is not intended as investment advice. Information and analysis above are derived from sources and utilising methods believed to be reliable, but we cannot accept responsibility for any losses you may incur as a result of this analysis. Individuals should consult with their personal financial advisors.
© 2005-2022 http://www.MarketOracle.co.uk - The Market Oracle is a FREE Daily Financial Markets Analysis & Forecasting online publication.