


U.S. Stock Market’s Volume is Low Around Thanksgiving
Stock-Markets / Stock Markets 2018 Nov 23, 2018 - 12:21 PM GMTBy: Troy_Bombardia

 Happy Thanksgiving! It’s important to remember that this week’s volume is very light, so don’t read too much into price action. The price can be easily pushed around by a few big players.
Let’s determine the stock market’s most probable direction by objectively quantifying technical analysis. For reference, here’s the random probability of the U.S. stock market going up on any given day, week, or month.

*Probability ≠ certainty.
Lots of New Lows
Lots of issues on the New York Stock Exchange have made new lows. Conventional technical analysts think that this is short-medium term bullish for the stock market. Is it?
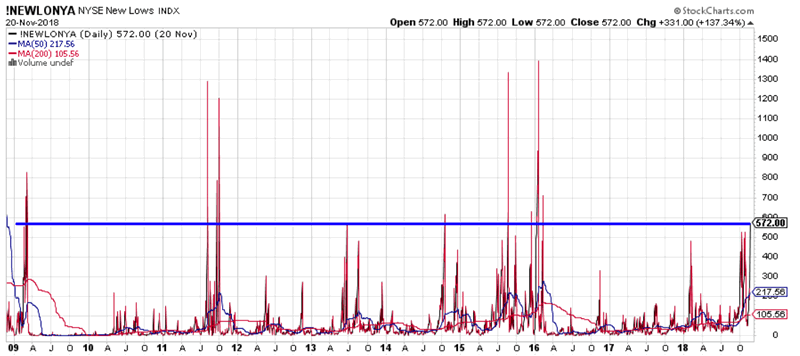
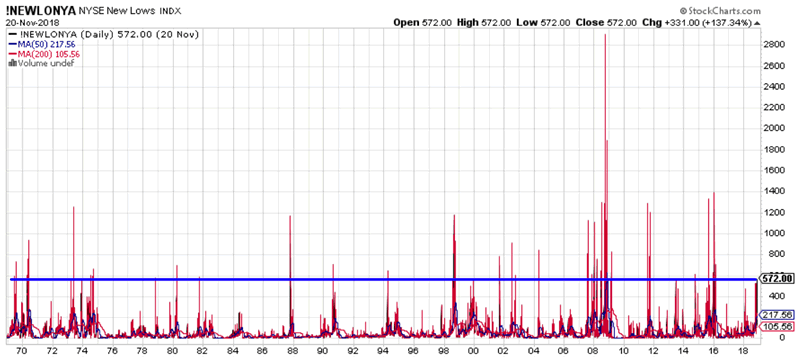
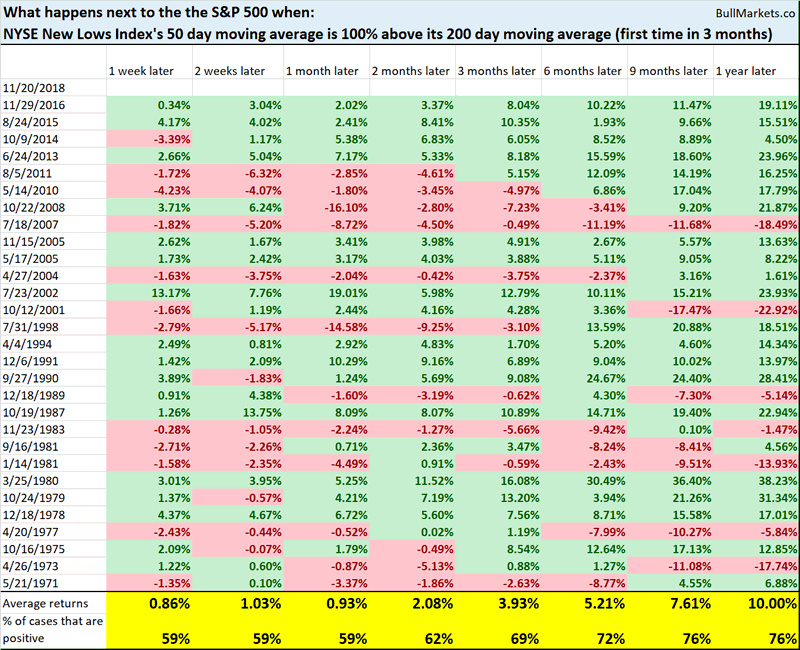
Here’s what happens next to the S&P 500 when the NYSE New Lows Index’s 50 day moving average is more than double that of its 200 day moving average.
*Data from 1970 – present
*We look at the distance between the 50 dma and 200 dma instead of looking at the NEWLONYA’s absolute value. This is because as the number of issues on the NYSE increases over time, NEWLOYA will forever make higher highs in the long term.
As you can see, the stock market’s forward returns are no different than random. This is neither consistently bullish nor bearish for stocks
S&P vs Oil
While the S&P 500 has gone down, oil has gone down even more. It seems like just yesterday Jeff Gundlach was calling for $100 oil.
*From what I’ve seen, Jeff Gundlach is good at predicting the bond market, but his equity & commodity predictions are no better than a coin toss. Just shows that everyone has a specialty. Trade only what you are good at.
As a result, the S&P:oil ratio’s RSI has become quite high.
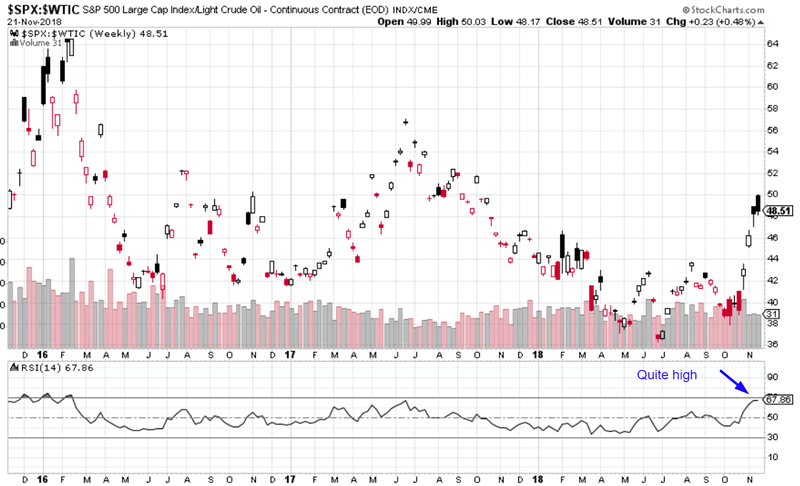
Here’s what happened next to the S&P when the S&P:oil ratio’s 14 weekly RSI exceeded 69
*Data from 1983 – present
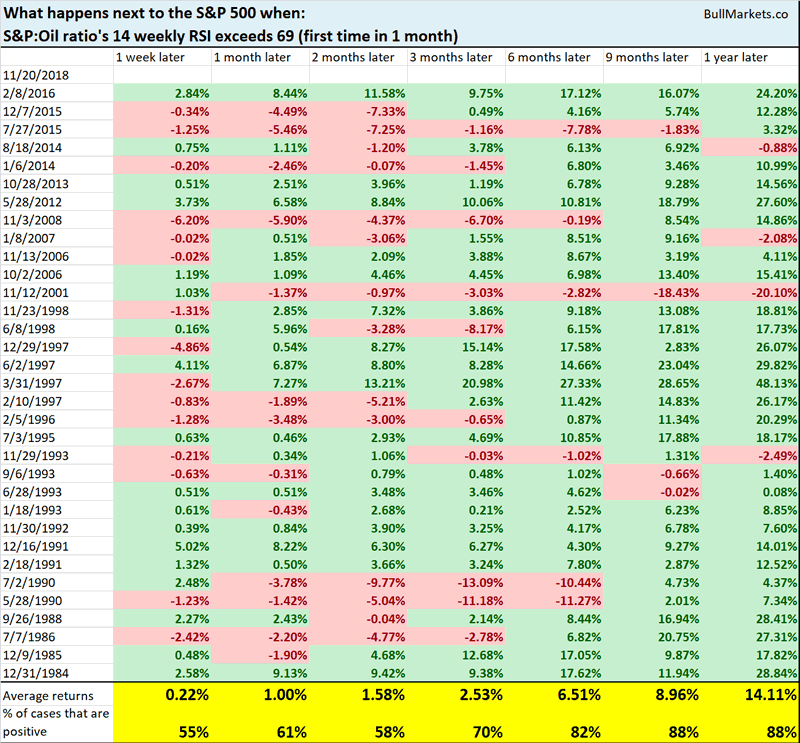
As you can see, the stock market tends to go up over the next 6-9 months.
NASDAQ death cross
The NASDAQ will probably make a “death cross” next week, whereby its 50 day moving average falls below its 200 day moving average.
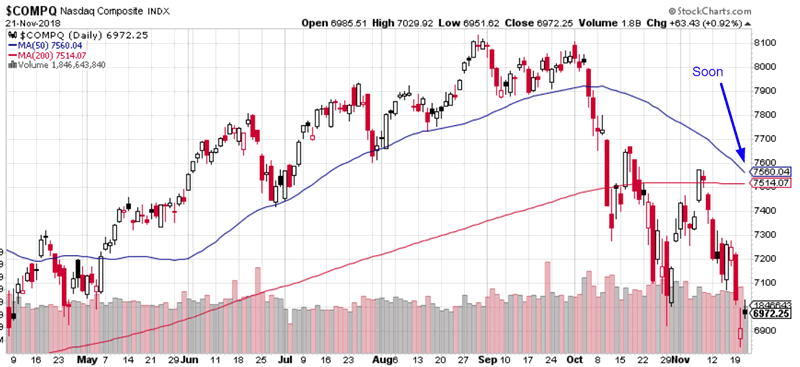
Is this bearish for the stock market?
Here’s what happens next to the NASDAQ (historically) when it makes a death cross.
*Data from 1971 – present
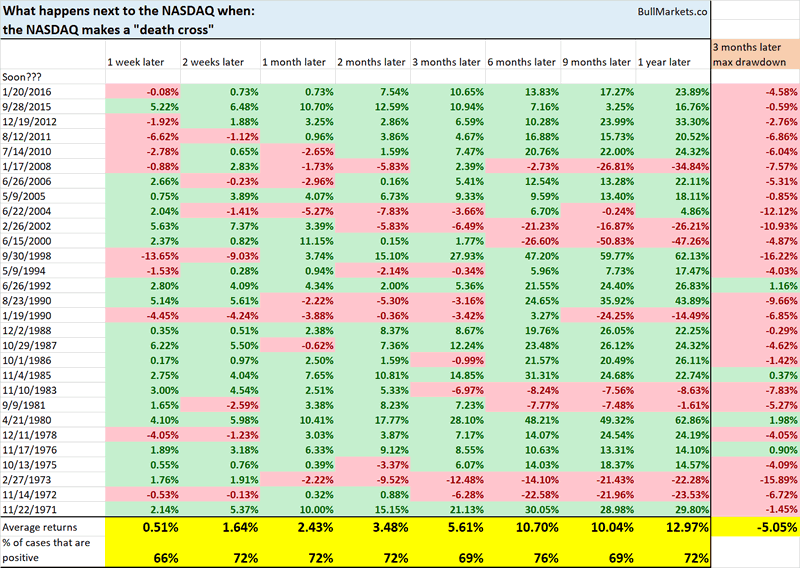
As you can see, the NASDAQ’s forward returns are no different than random. This is neither consistently bullish nor bearish for stocks
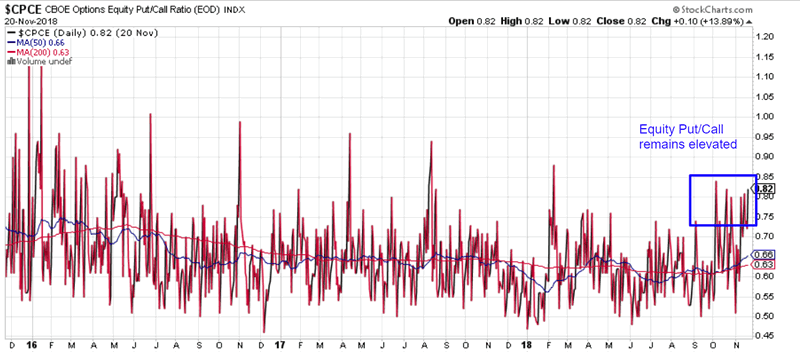
Equity Put/Call
While the Total Put/Call Ratio (a sentiment indicator) has come down a little, the Equity Put/Call Ratio remains high.
Here’s what happens next to the S&P 500 when the Equity Put/Call ratio’s 50 day moving average is more than 4% above its 200 day moving average (i.e. Equity Put/Call Ratio is trending up).
*Data from 2003 – present
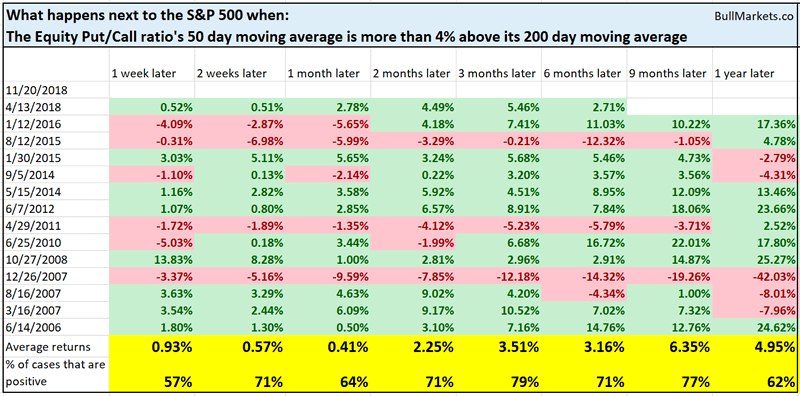
As you can see, the stock market’s forward returns are mostly no different than random, although there is a slight bullish lean 3 months later.
Click here to see yesterday’s market study
Conclusion
Our discretionary technical outlook has changed a little
- The current bull market will peak sometime in Q2 2019.
- The medium term remains bullish (i.e. approximately next half year).
- The short-medium term is mostly a 50-50 bet. With that being said, it leans bullish.
We focus on the medium term and long term. We mostly ignore the short term, which is usually just noise.
Our market outlook is not always a reflection of how we’re trading the markets right now. We trade based on our clear, quantitative trading models, such as the Medium-Long Term Model.
Members can see exactly how we’re trading the U.S. stock market right now based on our trading models.
Click here for more market studies
By Troy Bombardia
I’m Troy Bombardia, the author behind BullMarkets.co. I used to run a hedge fund, but closed it due to a major health scare. I am now enjoying life and simply investing/trading my own account. I focus on long term performance and ignore short term performance.
Copyright 2018 © Troy Bombardia - All Rights Reserved
Disclaimer: The above is a matter of opinion provided for general information purposes only and is not intended as investment advice. Information and analysis above are derived from sources and utilising methods believed to be reliable, but we cannot accept responsibility for any losses you may incur as a result of this analysis. Individuals should consult with their personal financial advisors.
© 2005-2022 http://www.MarketOracle.co.uk - The Market Oracle is a FREE Daily Financial Markets Analysis & Forecasting online publication.