


Amazon (AMZN) – Highlighting Next Area For Buyers
Companies / Amazon Nov 22, 2018 - 04:19 PM GMT

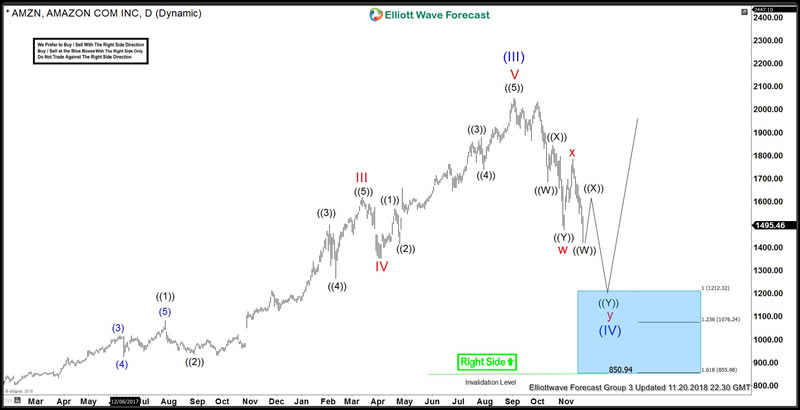
We recently wrote an article explaining why Mr Jeff Bezos had nothing to worry about after being down $45B in October’s market sell off and also stated the obvious fact that trend in Amazon (AMZN) is up and pull backs are a buying opportunity. AMZN reached our blue box area starting from $1477 at the end of October and buyers were waiting there as expected. We keep mentioning that once a blue box is reached, two things can happen, either the trend will resume or there will be a minimum 3 waves reaction from the blue box to allow the longs to eliminate risk on the trade by trailing stops or booking partial profits and then trailing stops. Amazon bounce quickly reached 50% Fibonacci retracement of the decline from 9/4/2018 peak which was good enough for the longs from $1477 to get risk free. However, sellers have managed to push price below 10/30/2018 low which creates an incomplete 5 swings sequence down from 9/4/2018 peak. Let’s take a look at the chart below
Amazon (AMZN) Elliott Wave Analysis – Daily Time Frame
Break below 10/30/2018 low opens up extension lower in Amazon stock. Cycle from red x peak at 11/8/2018 has either already ended at 1420 or would end between 1420 – 1348.39 followed by a bounce which should fail below 11/8/2018 (1784) for another sell off toward 1212.32 – 855.98 area to complete a double three Elliott wave structure down from 9/4/2018 peak. Wave ((X)) bounce should see short-term sellers appearing in the sequence of 3, 7 or 11 swings while area between 1212.32 -855.98 should attract swing traders as that’s where we have our blue box and to add to that, at 1212.32, Amazon would have lost 40% of it’s value from the all time high of 2050 in September 2018 which means sentiments would be extremely bearish and that should further add to the bullishness of AMZN stock in the above mentioned area.
By Daud Bhatti
https://elliottwave-forecast.com
ElliottWave-Forecast has built its reputation on accurate technical analysis and a winning attitude. By successfully incorporating the Elliott Wave Theory with Market Correlation, Cycles, Proprietary Pivot System, we provide precise forecasts with up-to-date analysis for 52 instruments including Forex majors & crosses, Commodities and a number of Equity Indices from around the World. Our clients also have immediate access to our proprietary Actionable Trade Setups, Market Overview, 1 Hour, 4 Hour, Daily & Weekly Wave Counts. Weekend Webinar, Live Screen Sharing Sessions, Daily Technical Videos, Elliott Wave Setup .
Copyright © 2018 ElliottWave-Forecast - All Rights Reserved Disclaimer: The above is a matter of opinion provided for general information purposes only and is not intended as investment advice. Information and analysis above are derived from sources and utilising methods believed to be reliable, but we cannot accept responsibility for any losses you may incur as a result of this analysis. Individuals should consult with their personal financial advisors.
© 2005-2022 http://www.MarketOracle.co.uk - The Market Oracle is a FREE Daily Financial Markets Analysis & Forecasting online publication.