


Why the Stock Market Will Pullback Before Heading Higher
Stock-Markets / Stock Markets 2018 Nov 11, 2018 - 03:37 PM GMTBy: Troy_Bombardia

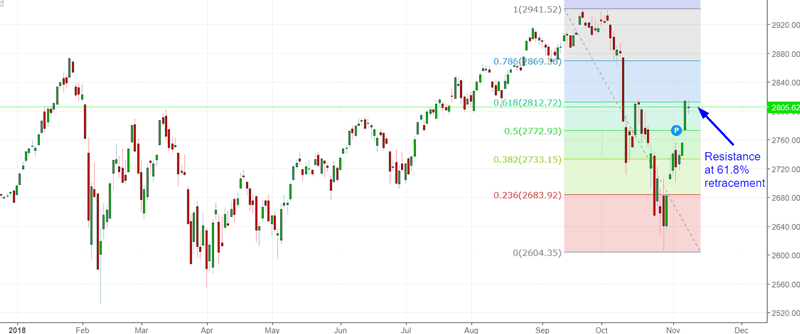
The S&P 500 has reached its 61.8% retracement and is now facing short term resistance (as expected).
Let’s determine the stock market’s most probable direction by objectively quantifying technical analysis. For reference, here’s the random probability of the U.S. stock market going up on any given day, week, or month.

*Probability ≠ certainty.
The stock market is not “breaking down”
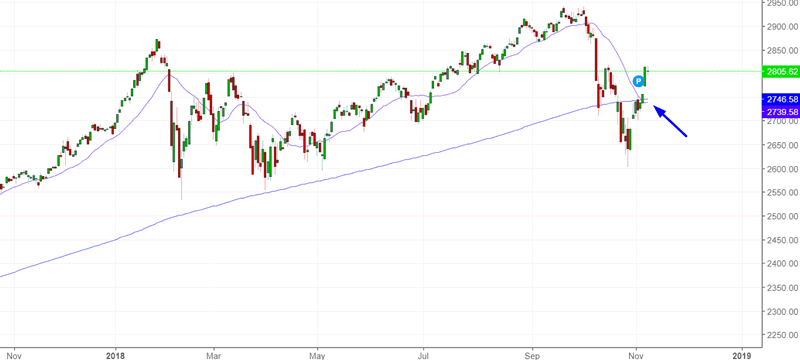
The S&P 500’s 21 day moving average (1 month moving average) crossed below its 252 day moving average (1 year moving average) this Tuesday.
Traders who use MACD will see such “breakdowns” (similar to death crosses) as bearish signs.
They’re not.
This is the first time the 1 month moving average has crossed below the 1 year moving average in more than 2.5 years (since early-2016).
When such long uptrends end, the stock market can experience more weakness over the next few weeks/months, but it usually goes higher 9-12 months later. (This is also how earlier this year, we knew that January 2018 wasn’t the bull market’s top). Strength begets more strength.
Here’s what happened next to the S&P 500 when its 1 month moving average falls below its 1 year moving average for the first time in at least 2 years.
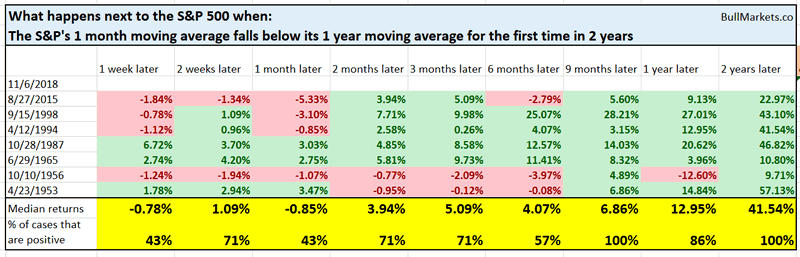
As you can see, the S&P tends to go up 9 months later.
Short-medium term is more mixed
Our studies over the past 2 weeks have been consistently medium term bullish for the stock market.
Now that the stock market has rallied, the medium term’s returns are more mixed. Some studies are medium term bullish (as highlighted yesterday), and some studies are medium term bearish.
Here are 2 medium term bearish studies.
The S&P 500 has rebounded rapidly. The S&P’s 14 day RSI has gone from under 25 to over 55 in less than 3 weeks, which is very fast.
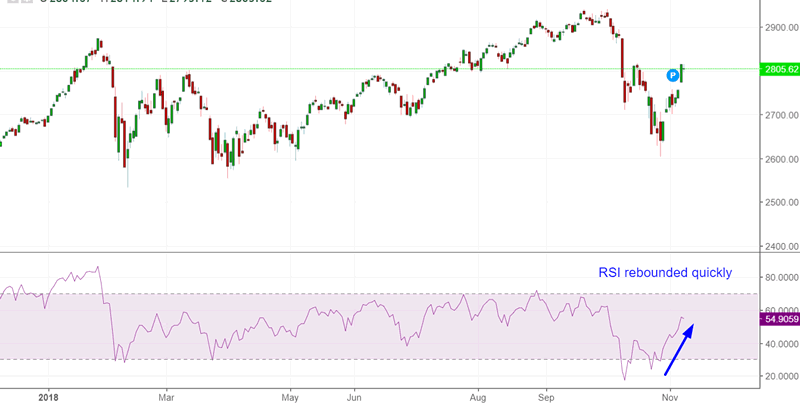
Here’s what happened next to the S&P when its 14 day RSI went from under 25 to above 55 in less than 3 weeks, while within 10% of a 2 year high.
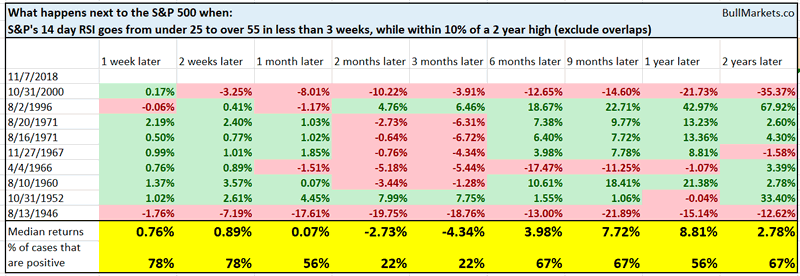
As you can see, the S&P tends to fall a little over the next 2-3 months, after which it recovers.
Meanwhile, NYMOT (NYSE traditional McClellan Oscillator) has also rebounded rapidly. NYMOT is a breadth indicator.
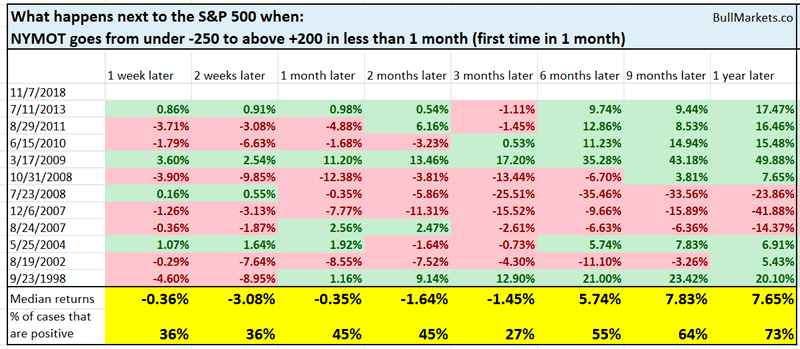
Here’s what happened next to the S&P 500 when NYMOT went from under -250 to above +200 in less than 1 month.
As you can see, the S&P tends to fall over the next 1-3 months.
What not to worry about
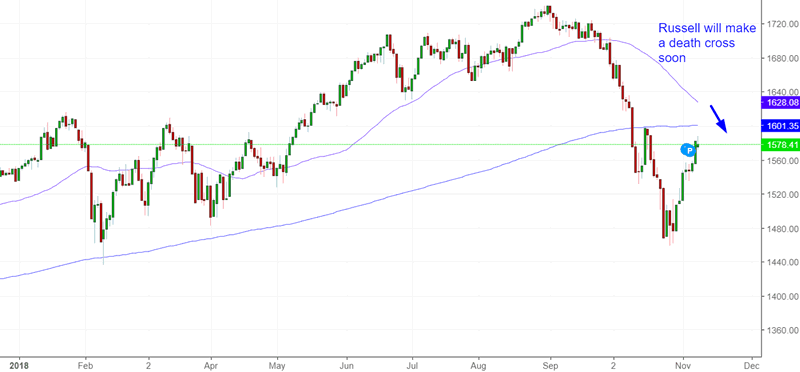
The Russell 2000 will soon make a “death cross” (its 50 day moving average will cross below its 200 day moving average).
When that happens, you can be sure that financial media will trip over themselves screaming “HOLY SHIT THE WORLD IS ENDING!!!! SMALL CAPS MADE A DEATH CROSS!!!!”
Here’s what happens next to the Russell (historically) when it makes a “death cross”.
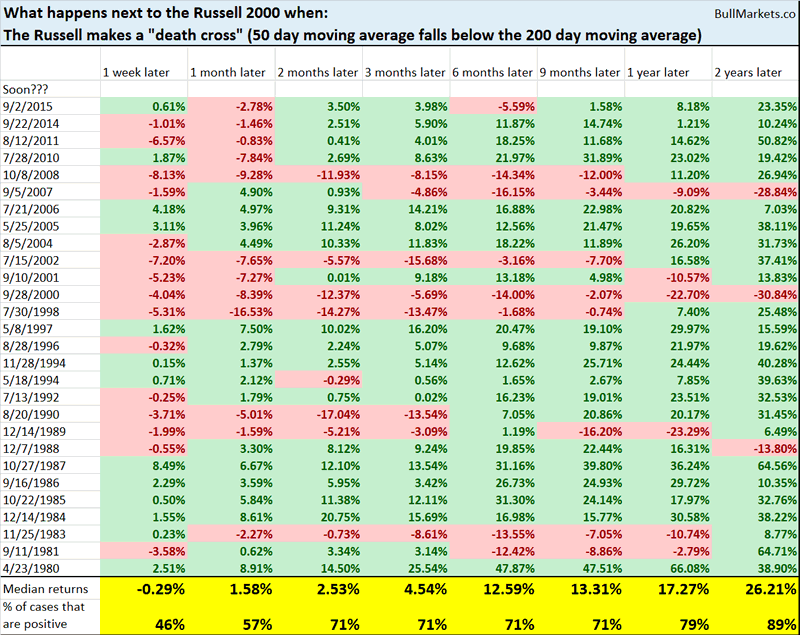
As you can see, the Russell’s forward returns are no different than random. This is neither consistently bullish nor consistently bearish for the stock market.
Conclusion
Our discretionary technical outlook remains the same:
- The current bull market will peak sometime in Q2 2019.
- The medium term remains bullish (i.e. trend for the next 6-9 months).
- The short-medium term leans bearish. There’s a >50% chance that the S&P will fall in the next few weeks.
Focus on the medium term and long term. The short term is usually just noise.
Our discretionary outlook is usually, but not always, a reflection of how we’re trading the markets right now. We trade based on our clear, quantitative trading models, such as the Medium-Long Term Model.
Members can see exactly how we’re trading the U.S. stock market right now based on our trading models.
Click here for more market studies
By Troy Bombardia
I’m Troy Bombardia, the author behind BullMarkets.co. I used to run a hedge fund, but closed it due to a major health scare. I am now enjoying life and simply investing/trading my own account. I focus on long term performance and ignore short term performance.
Copyright 2018 © Troy Bombardia - All Rights Reserved
Disclaimer: The above is a matter of opinion provided for general information purposes only and is not intended as investment advice. Information and analysis above are derived from sources and utilising methods believed to be reliable, but we cannot accept responsibility for any losses you may incur as a result of this analysis. Individuals should consult with their personal financial advisors.
© 2005-2022 http://www.MarketOracle.co.uk - The Market Oracle is a FREE Daily Financial Markets Analysis & Forecasting online publication.