


Stock Market Was Supposed to “Crash Like 1987”
Stock-Markets / Stock Markets 2018 Nov 10, 2018 - 03:54 PM GMTBy: Troy_Bombardia

 It seems like just yesterday when everybody on CNBC was saying “here’s why the stock market could crash like 1987”.
With that being said, the S&P has made a perfect 61.8% retracement of its current correction. We predicted over the past 2 weeks:
Even if this is the start of a bear market, the S&P will bounce and retrace 50-61.8% of its decline. Bear markets don’t go down in a straight line.
If this is a bull market’s correction (much more likely scenario), the S&P will bounce to 50-61.8%, make a short term pullback, and then rally higher.
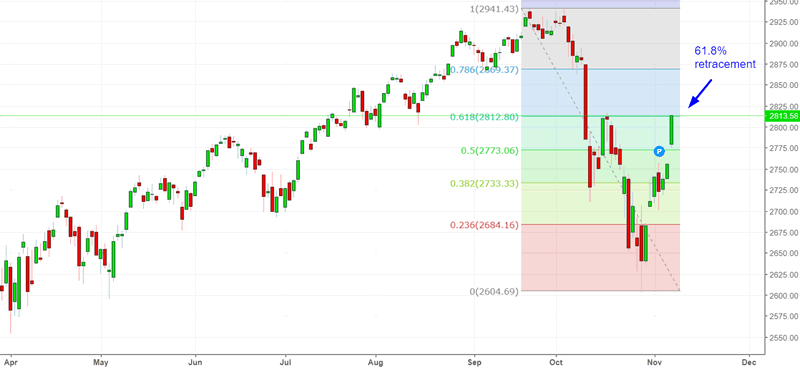
We are sticking to the bull market case right now.
Let’s determine the stock market’s most probable direction by objectively quantifying technical analysis. For reference, here’s the random probability of the U.S. stock market going up on any given day, week, or month.

*Probability ≠ certainty.
Big gap up
The S&P 500 made a big gap up yesterday.
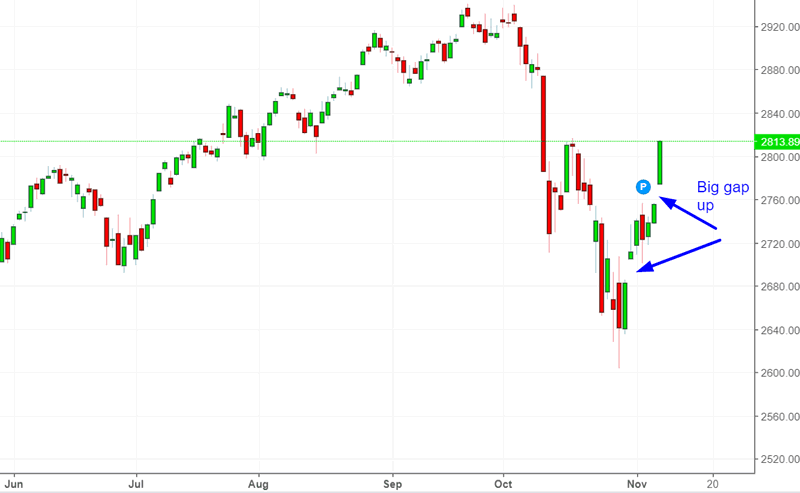
Conventional technical analysis sees such big gap ups as “bear market symptoms”. That is factually incorrect.
Here’s what happened next to the S&P 500 when today’s daily LOW is more than 0.5% above yesterday’s daily HIGH.
*Data from 1962 – present
As you can see, the stock market tends to do well 6-9 months later. None of these cases occurred in a bear market.
Why?
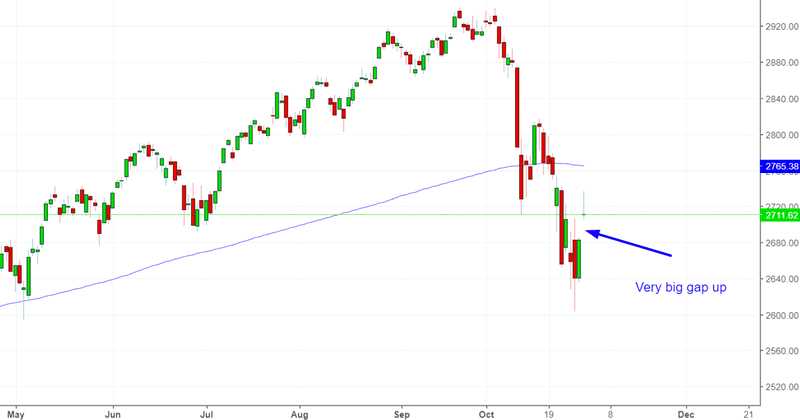
Because while bear markets often see big gap ups on the opening bell, a lot of these gaps are immediately filled by massive intraday swings.
Breadth’s rapid recovery
The S&P 500’s breadth has made a rapid recovery.
The % of stocks above their 200 dma has reversed, along with the stock market itself.
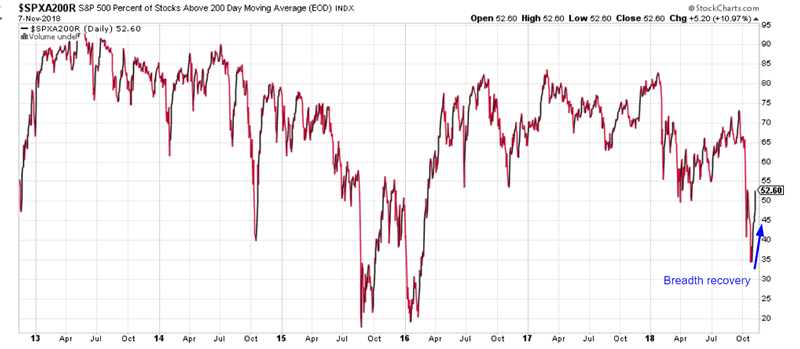
Here’s what happened next to the S&P 500 when the % of stocks above their 200 dma went from below 35% to above 50% in less than 2 weeks.
*Data from 2004 – present
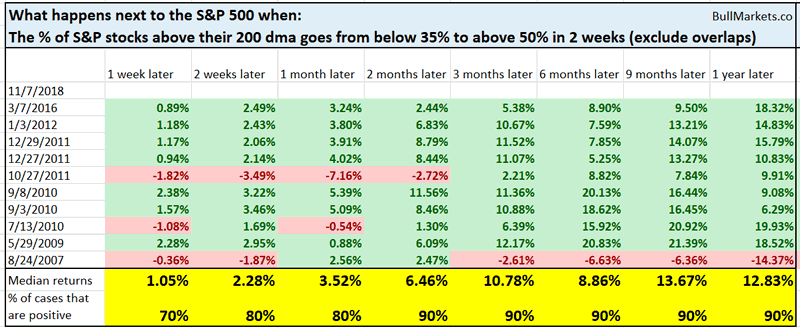
While the data is limited, you can see that the S&P tends to do well over the next 2 months.
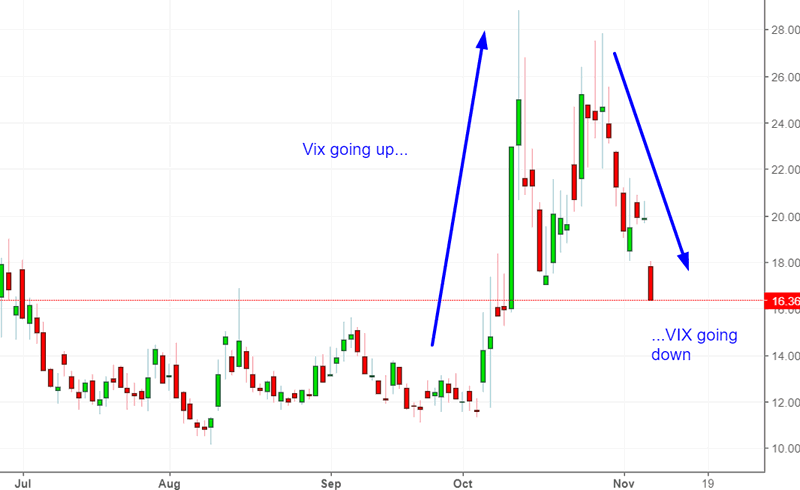
VIX’s roundtrip
VIX has made a roundtrip. It spiked, and is now falling.
Here’s what happened next to VIX when it spiked above 25 and then fell below 17 in less than 3 weeks (i.e. right now)
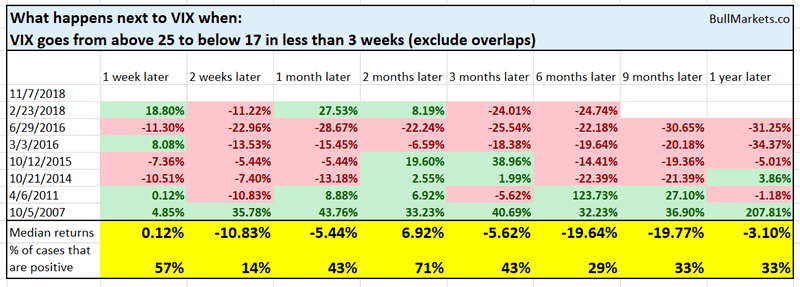
As you can see, volatility usually continues to fall.
*Volatility and the stock market move in the opposite direction.
Click here to see yesterday’s market study
Conclusion
Our discretionary technical outlook remains the same:
- The current bull market will peak sometime in Q2 2019.
- The medium term remains bullish (i.e. trend for the next 6-9 months).
- The short term is slightly bearish. There’s a slightly >50% chance that the S&P will fall in the next 1-2 weeks. This probability isn’t exceptionally high, so I wouldn’t bank on it.
Focus on the medium term and long term. The short term is usually just noise.
Our discretionary outlook is usually, but not always, a reflection of how we’re trading the markets right now. We trade based on our clear, quantitative trading models, such as the Medium-Long Term Model.
Members can see exactly how we’re trading the U.S. stock market right now based on our trading models.
Click here for more market studies
By Troy Bombardia
I’m Troy Bombardia, the author behind BullMarkets.co. I used to run a hedge fund, but closed it due to a major health scare. I am now enjoying life and simply investing/trading my own account. I focus on long term performance and ignore short term performance.
Copyright 2018 © Troy Bombardia - All Rights Reserved
Disclaimer: The above is a matter of opinion provided for general information purposes only and is not intended as investment advice. Information and analysis above are derived from sources and utilising methods believed to be reliable, but we cannot accept responsibility for any losses you may incur as a result of this analysis. Individuals should consult with their personal financial advisors.
© 2005-2022 http://www.MarketOracle.co.uk - The Market Oracle is a FREE Daily Financial Markets Analysis & Forecasting online publication.