


USD/CAD – The Moment of Truth Is Coming
Currencies / Forex Trading Nov 09, 2018 - 02:23 PM GMTBy: Nadia_Simmons

 Although the U.S. dollar increased recently against its Canadian counterpart, currency bulls didn’t manage to trigger an upward move above the 61.8% Fibonacci retracement for the third time in a row. Will their nearest ally be able to stop the selling pressure once again in the coming days?
EUR/USD Meets Fibonacci Retracement
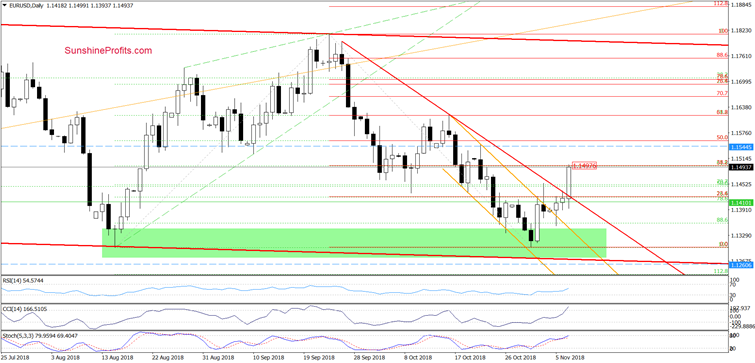
Yesterday, we wrote that EUR/USD invalidated the earlier breakdown under the upper line of the orange declining trend channel. Taking this positive development into account and combining it with the lack of the sell signals, we think that further improvement is still ahead of us.
If this is the case and the pair moves higher from current levels, we’ll see at least a test of the 38.2% Fibonacci retracement (around 1.5000). If it is broken, the way to our initial upside target, the October 22 peak and the next retracement will be open.
From today’s point of view, we see that the situation developed in tune with our assumptions and EUR/USD moved sharply higher earlier today, reaching our first upside targets - the 38.2% Fibonacci retracement and making our long positions even more profitable.
Thanks to today’s upswing, the pair also broke above the short-term red declining resistance line based on the September 26 and the mid-October peaks, which increases the probability that we’ll see further improvement in the very near future – especially when we factor in the fact that there are still no sale signals that could encourage currency bears to act.
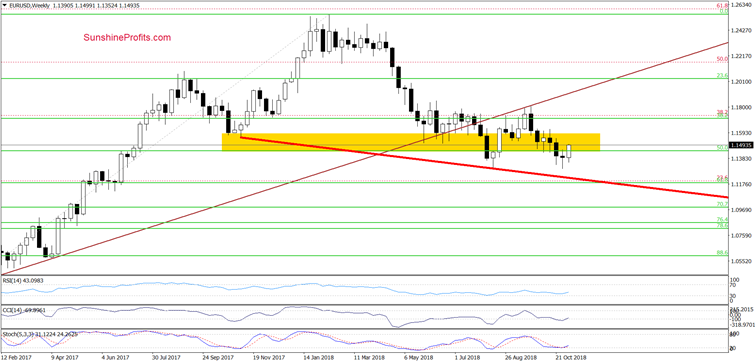
And speaking about indicators… the medium-term CCI and the Stochastic Oscillator generated buy signals (seen on the weekly chart below), supporting the buyers and (at least) an increase to our upside targets in the following days.
USD/JPY – Sharp Decline and Its Consequences
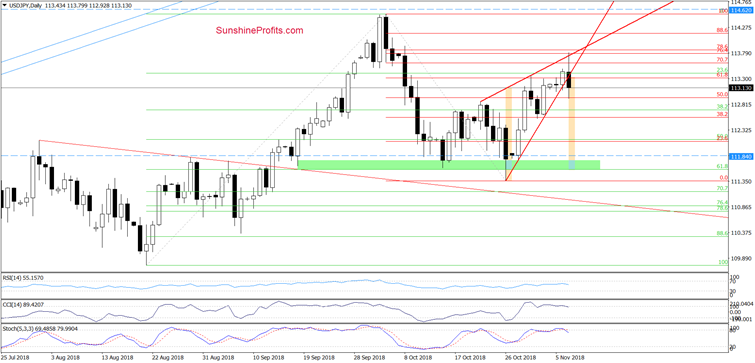
In our yesterday’s alert, we wrote that USD/JPY climbed to our upside target, but then reversed and pulled back, invalidating the earlier tiny breakout above the 61.8% Fibonacci retracement. Such price action together with the current position of the indicators suggests that another move to the downside from here is likely.
Therefore, if the exchange rate increases (…) once again, we’ll close our long positions and take profits off the table (…).
Looking at the daily chart, we see that currency bulls triggered one more upswing, which allowed us to close our positions at a profit. Earlier today, the pair increased one again, but this improvement was very temporary as the upper line of the red rising wedge together with the 76.4%, the 78% Fibonacci retracements and the sell signals generated by the indicators encouraged the sellers to act.
As a result, the exchange rate reversed and dropped under the lower line of the red wedge, which suggests that further deterioration is just around the corner. If this is the case and USD/JY declines from current levels, we’ll likely see a drop to the green support area created by the recent lows and the 61.8% Fibonacci retracement in the following days.
USD/CAD – Which Way Next?
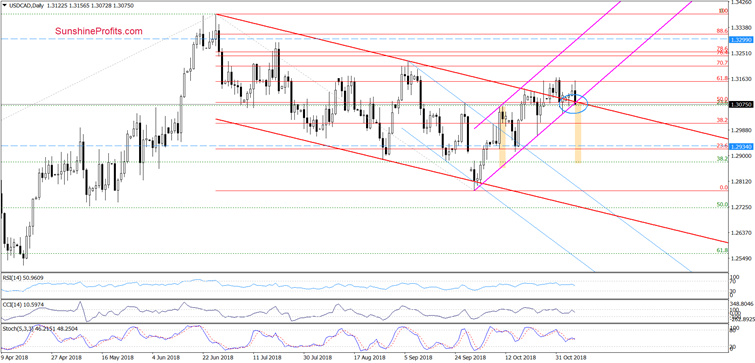
On the daily chart, we see that although USD/CAD bounced off the lower border of the pink rising trend channel in the previous week, currency bulls didn’t manage to successfully break above the recent peaks and the 61.8% Fibonacci retracement.
Earlier today, the above-mentioned resistances encouraged the sellers to act, which caused an invalidation of the earlier breakout above the upper border of the red declining trend channel. Thanks to today’s downswing the pair also slipped below the lower border of the pink rising trend channel, which increases the likelihood of further deterioration in the coming days.
If we see such price action, USD/CAD will likely drop to at least mid-October lows. At this point it is also worth noting that not far from them the size of the downward move will correspond to the height of the pink trend channel, which may be encouraging for the sellers and their willingness to take profits in this area.
USD/CHF – Short-term Consequences of Long-term Resistance
In our Forex Trading Alert posted on October 31, 2018, we wrote the following:
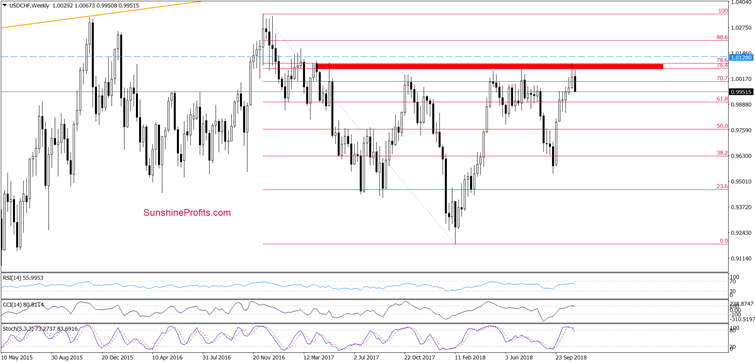
(…) USD/CHF also approached the red resistance zone created by the 76.4% and the 78.6% Fibonacci retracements, which was strong enough to trigger a reversal in May and July.
Therefore, in our opinion, further rally and a test of December 2016 peak will be more likely and reliable only if we see a successful breakout above the above-mentioned red zone. Until this time, one more reversal should not surprise us.
Looking at the weekly chart, we see that USD/CHF declined quite sharply (as we had expected), making our short positions even more profitable.
How did this drop affect the very short-term picture of the exchange rate?
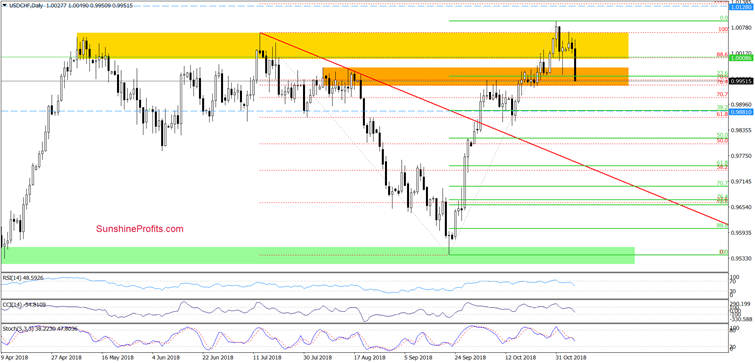
From this perspective, we see that Monday’s unsuccessful attempt to break above the yellow resistance zone woke up the bears and lured them back to the trading floor. Thanks to their attack USD/CHF declined sharply, reaching the 23.6% Fibonacci retracement and approaching the lower border of the orange zone earlier today.
Although this area can trigger a small rebound, the sell signals generated by the daily indicators continue to support the sellers. Additionally, the medium-term indicators generated the sell signals, suggesting that lower values of the exchange rate in the very near future are very likely.
Connecting the dots, we believe that if the exchange rate extends loses from here, we’ll see at least a drop to around 0.9881, where the 38.2% Fibonacci retracement is.
If you enjoyed the above analysis and would like to receive free follow-ups, we encourage you to sign up for our daily newsletter – it’s free and if you don’t like it, you can unsubscribe with just 2 clicks. If you sign up today, you’ll also get 7 days of free access to our premium daily Oil Trading Alerts as well as Gold & Silver Trading Alerts. Sign up now.
Nadia Simmons
Forex & Oil Trading Strategist
Przemyslaw Radomski
Founder, Editor-in-chief
Sunshine Profits: Gold & Silver, Forex, Bitcoin, Crude Oil & Stocks
Stay updated: sign up for our free mailing list today
* * * * *
Disclaimer
All essays, research and information found above represent analyses and opinions of Nadia Simmons and Sunshine Profits' associates only. As such, it may prove wrong and be a subject to change without notice. Opinions and analyses were based on data available to authors of respective essays at the time of writing. Although the information provided above is based on careful research and sources that are believed to be accurate, Nadia Simmons and his associates do not guarantee the accuracy or thoroughness of the data or information reported. The opinions published above are neither an offer nor a recommendation to purchase or sell any securities. Nadia Simmons is not a Registered Securities Advisor. By reading Nadia Simmons’ reports you fully agree that he will not be held responsible or liable for any decisions you make regarding any information provided in these reports. Investing, trading and speculation in any financial markets may involve high risk of loss. Nadia Simmons, Sunshine Profits' employees and affiliates as well as members of their families may have a short or long position in any securities, including those mentioned in any of the reports or essays, and may make additional purchases and/or sales of those securities without notice.
© 2005-2022 http://www.MarketOracle.co.uk - The Market Oracle is a FREE Daily Financial Markets Analysis & Forecasting online publication.