


Is the Stock Market’s Rally “All Good To Go”?
Stock-Markets / Stock Markets 2018 Nov 08, 2018 - 06:23 PM GMTBy: Troy_Bombardia

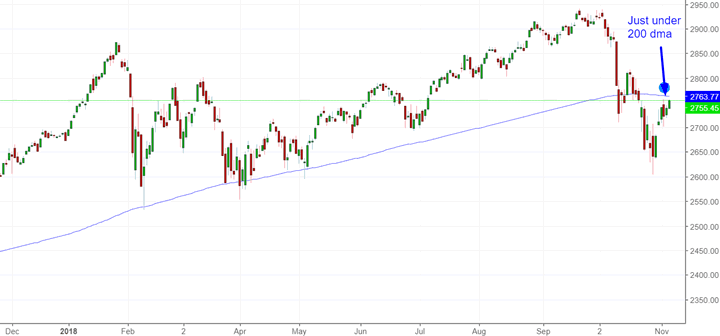
The S&P 500 is just under its 200 dma.
Let’s determine the stock market’s most probable direction by objectively quantifying technical analysis. For reference, here’s the random probability of the U.S. stock market going up on any given day, week, or month.

*Probability ≠ certainty.
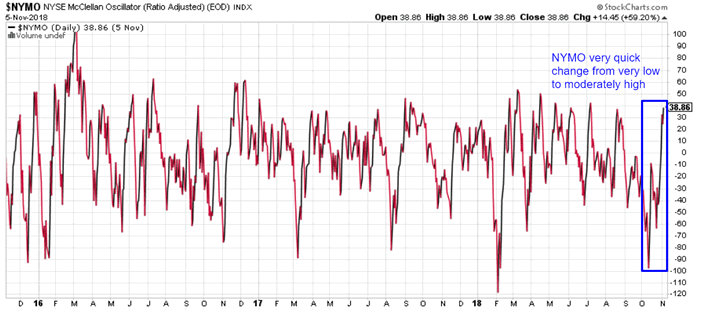
The stock market’s breadth has mean-reverted
The stock market’s breadth has mean-reverted from a very low level. For example, NYMO (a breadth indicator) has swung from very low back to a normal value in a short amount of time.
Here’s what happened next to the S&P 500 (historically) when NYMO fell below -90 and rose above +35 within 1 month.
*Data from 1998 – present
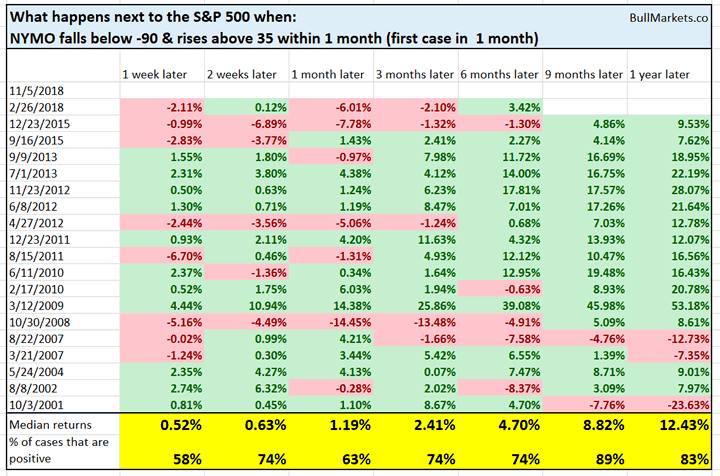
As you can see, the stock market tends to do well over the next 9 months. The only 2 bearish cases are August 2007 and October 2001
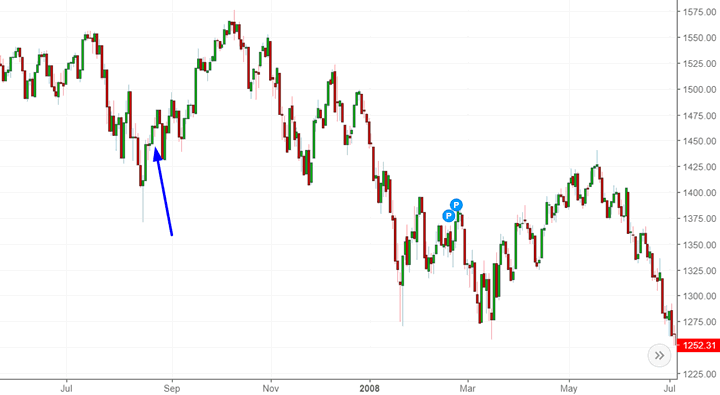
The August 2007 case saw the stock market rally for another 1.5 months before topping.
Meanwhile, the October 2001 case clearly does not apply to today because the stock market had already crashed 30%+. That’s a completely different context.
More signs of short term weakness?
Our short term (i.e. next 1-4 weeks) studies have been mixed recently. Some are bullish while others are bearish. But on balance, there are slightly more short term bearish studies than short term bullish studies.
The S&P has broken above its 20 day moving average for the first time in 24 days (quite a long time), while the 200 day moving average is trending down.
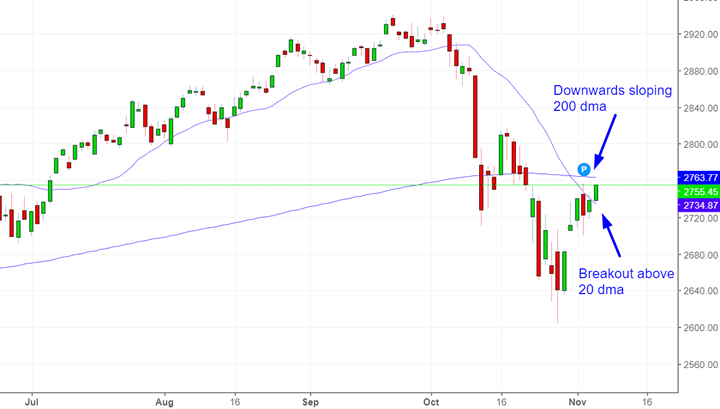
Is this breakout a short term sign of “all clear” for the U.S. stock market?
Here’s what happens next to the S&P 500 when it rises above its 20 dma for the first time in 24 days, while the 200 day moving average is going down.
*Data from 1927 – present
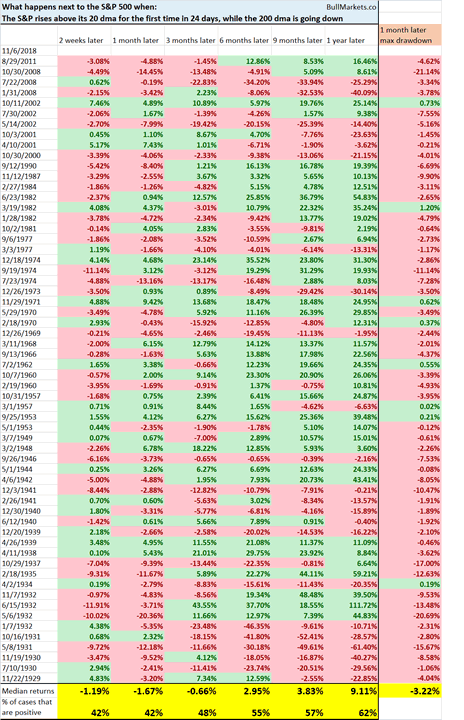
As you can see, the S&P has a slight tendency to fall over the next 1 month, after which forward returns start to improve.
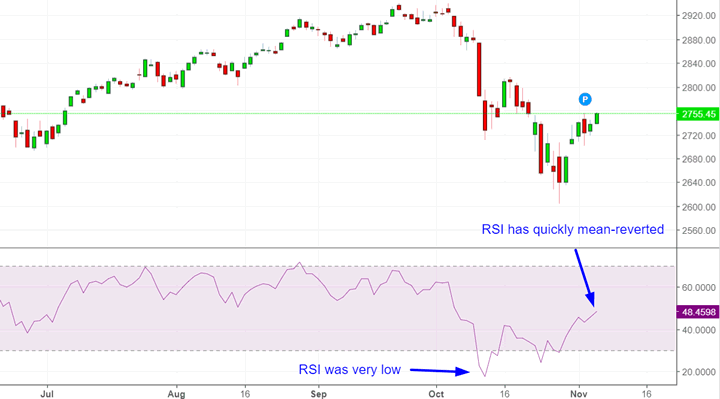
It’s also worth noting that the S&P’s RSI has quickly mean-reverted.
*RSI is a popular momentum/contrarian indicator
Here’s what happens next to the S&P when its 14 day RSI falls below 18 and rises above 48 in less than 1 month.
*Data from 1927 – present
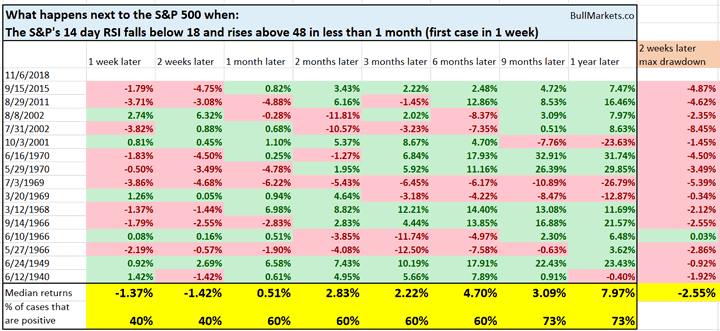
Once again, you can see that the stock market tends to face some short term weakness in the next 2 weeks.
This is because V-shaped corrections are uncommon. Most of these fast 10%+ corrections see a bounce and then a retracement/retest before rallying to new highs.
Click here to see yesterday’s market study
Conclusion
Our discretionary technical outlook remains the same:
- The current bull market will peak sometime in Q2 2019.
- The medium term remains bullish (i.e. trend for the next 6-9 months).
- The short term is slightly bearish. There’s a slightly >50% chance that the S&P will fall in the next 1-2 weeks. This probability isn’t exceptionally high, so I wouldn’t bank on it.
- When the stock market’s short term is unclear (as it is most of the time), focus on the medium term. Step back and look at the big picture. Don’t lose yourself in a sea of noise.
Our discretionary outlook is usually, but not always, a reflection of how we’re trading the markets right now. We trade based on our clear, quantitative trading models, such as the Medium-Long Term Model.
Members can see exactly how we’re trading the U.S. stock market right now based on our trading models.
Click here for more market studies
By Troy Bombardia
I’m Troy Bombardia, the author behind BullMarkets.co. I used to run a hedge fund, but closed it due to a major health scare. I am now enjoying life and simply investing/trading my own account. I focus on long term performance and ignore short term performance.
Copyright 2018 © Troy Bombardia - All Rights Reserved
Disclaimer: The above is a matter of opinion provided for general information purposes only and is not intended as investment advice. Information and analysis above are derived from sources and utilising methods believed to be reliable, but we cannot accept responsibility for any losses you may incur as a result of this analysis. Individuals should consult with their personal financial advisors.
© 2005-2022 http://www.MarketOracle.co.uk - The Market Oracle is a FREE Daily Financial Markets Analysis & Forecasting online publication.