


Stocks Made a Post-crash Bounce. What’s Next?
Stock-Markets / Stock Markets 2018 Nov 07, 2018 - 03:28 PM GMTBy: Troy_Bombardia

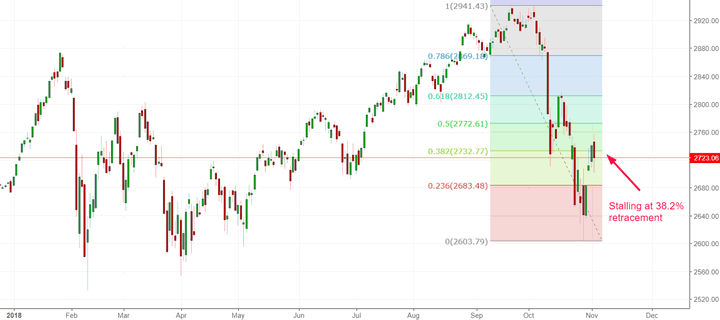
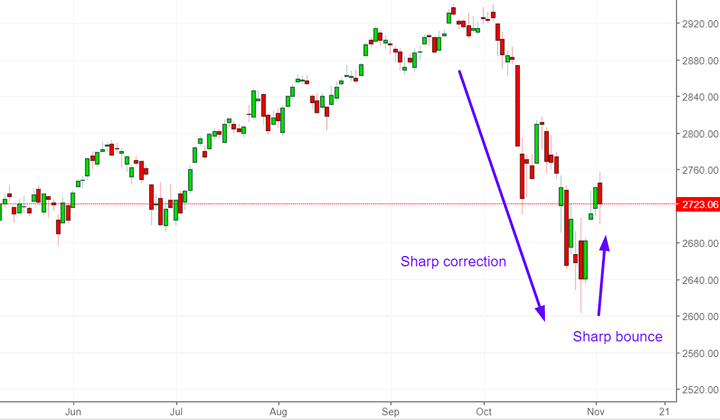
 The S&P 500 has made a correction and its bounce stalled at the 38.2% retracement.
Here’s our long term, medium term, and short term outlook for the U.S. stock market. As U.S. stock market investors and traders, our job is to separate the signal from the noise.
The economy’s fundamentals determine the stock market’s medium-long term outlook. Technicals determine the stock market’s short-medium term outlook. Here’s why:
- The stock market’s long term is bullish. The bull market will probably peak in Q2 2019.
- The stock market’s medium term is bullish.
- The stock market’s short term is mostly a 50-50 bet, although it is slightly bearish.
We focus on the medium and long term. Let’s go from the long term, to the medium term, to the short term.
Long Term
Our long term outlook remains bullish. This bull market will probably last until Q2 2019, after which a bear market will ensue.
The economy and the stock market move in the same direction in the long term. Hence, leading economic indicators are also long term leading stock market indicators.
Leading indicators are starting to show some signs of deterioration, but not enough for the bull market to peak (which means that September 2018 likely wasn’t the bull market’s top). The usual chain of events looks like this:
- Big ticket sales (e.g. housing, auto sales) are the earliest leading indicators to deteriorate. Meanwhile, the U.S. stock market is still in a bull market while the rest of the U.S. economy improves. The rally gets choppy, with volatile corrections along the way. We are here right now
- The labor market starts to deteriorate. Meanwhile, the U.S. stock market is still in a bull market. This hasn’t happened yet, but will most likely start to happen in Q1 2019
- The labor market deteriorates some more, while other economic indicators start to deteriorate. The stock market tops, and the bull market is over.
Let’s look at the data.
Capital Spending Capital Spending is starting to decrease, and will most likely continue to decrease over the next several quarters as CEO’s economic outlook worsens.
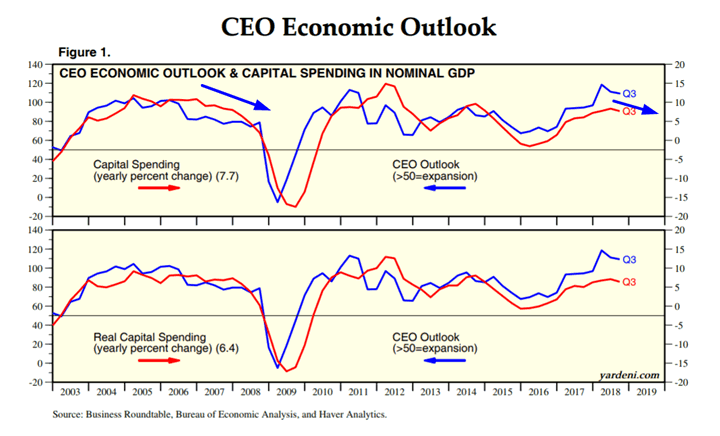
Source: Yardeni
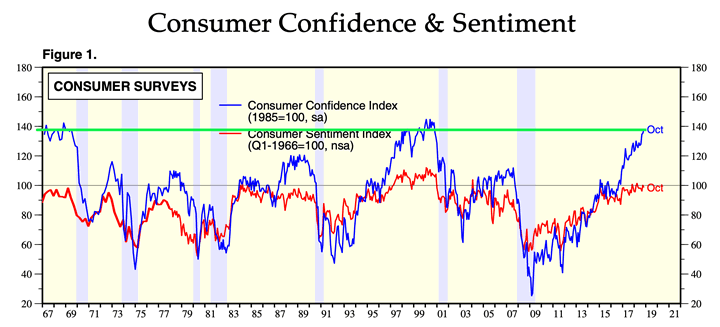
Consumer Confidence
Consumer Confidence is extremely high. While this isn’t immediately bearish for the stock market, Consumer Confidence is usually this high during the last year of a bull market.
This suggests that the bull market doesn’t have a lot of room left.
Full employment
The Unemployment Rate – CPI is a better measure of “full employment”. As you can see, this figure fell to 0 before previous bear markets and recessions.
This figure is close to 0 right now, which suggests that this bull market and economic expansion don’t have a lot more room to run.
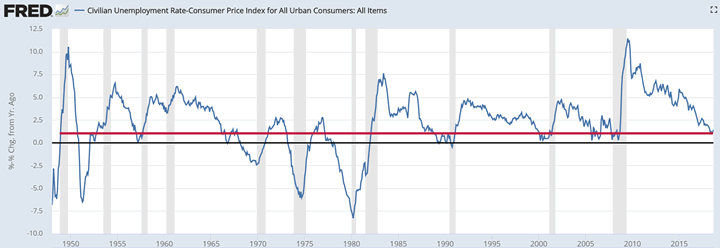
Source: Yardeni
Initial Claims & Continued Claims
Initial Claims and Continued Claims continue to trend downwards. In the past, these 2 data series trended upwards before bear markets and economic recessions began.
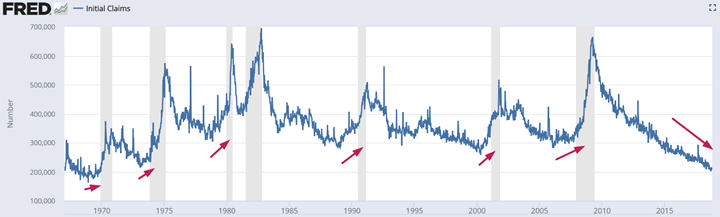
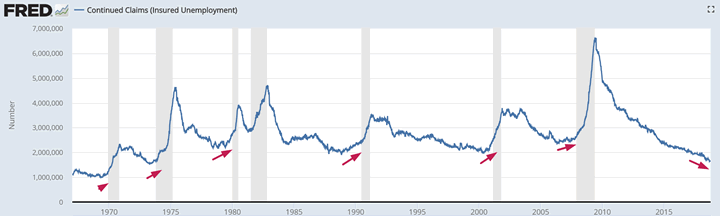
Source: FRED
Truck Tonnage
Truck Tonnage continues to trend higher. This figure trended lower before previous recessions and bear markets.
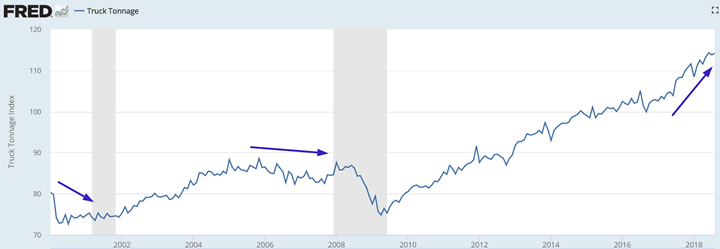
Source: FRED
Here’s a non-updated chart from Bill McBride, demonstrating how Truck Tonnage leads the economy and stock market.
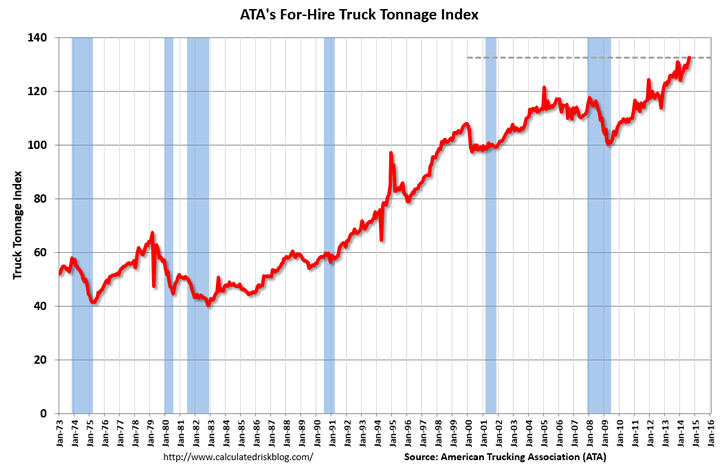
Source: Bill McBride, Calculated Risk
Medium Term
While the economic data suggests that September 2018 wasn’t the bull market’s top, let’s assume that we’re wrong. Let’s assume the worst case scenario, which is that September 2018 was the top.
Even if this is the start of a bear market, the stock market will probably soon make a medium term bounce. The big 40%+ bear markets (2007, 2000, 1973, 1969) don’t go down in a straight line. There are always big bounces along the way in the first 3-6 months of these bear markets as late buy-the-dip investors come in at what they deem to be “bargain prices”.
*For reference, here’s the random probability of the U.S. stock market going up on any given day, week, or month.

Stocks fell while interest rates went up in the current correction. This is uncommon. Interest rates usually fall when the stock market makes a rapid decline (flight to safety).
Here’s what happens next (historically) when the S&P falls more than -9% in 5 weeks from a 1 year high, while the 10 year yield goes up (e.g. right now).
*Data from 1962 – present
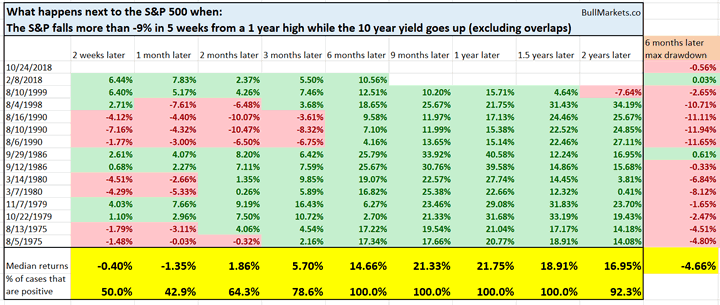
As you can see, while the stock market tends to experience more short term weakness and volatility over the next 1 week, the medium term returns are excellent (6-12 months later).
The data suggests that rising interest rates aren’t consistently bearish for stocks. This goes against conventional financial belief.
After 6 months of badly underperforming the U.S. stock market, emerging markets are finally starting to outperform U.S. stocks. Here’s the S&P:EEM ratio (EEM is the emerging markets ETF).
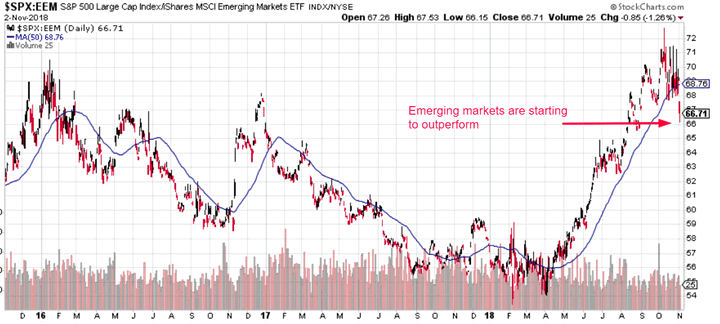
Source: StockCharts
As you can see, this ratio has firmly closed below its 50 day moving average for the first time since April 2018.
Here’s what happened next to the S&P 500 (historically) when the S&P:EEM ratio closed below its 50 day moving average for 2 consecutive days (first time in 6 months).
*Data from 1996 – present
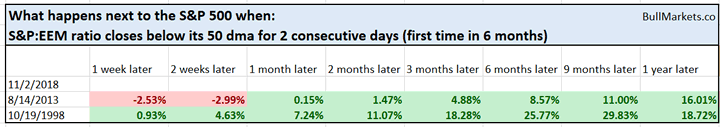
As you can see, it’s uncommon for the U.S. stock market to outperform emerging markets for so long. When this outperformance ends, the stock market can experience short term volatility, but the medium term is bullish.
*This study has a sample size of 2, and data is limited from 1996 – present. So don’t focus too much on this study.
VIX’s weekly bar has finally closed below its upper Bollinger Band (20 weekly, 2 standard deviation) after spending 3 consecutive weeks above the upper Bollinger Band. In other words, VIX has mean-reverted.
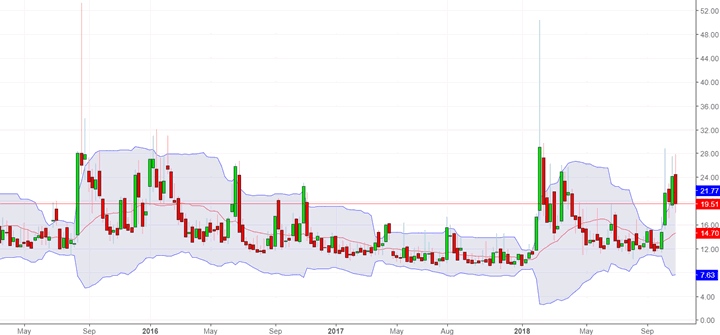
Source: Investing.com
Here’s what happened next to the S&P 500 (historically) when VIX spent 3 consecutive weeks above its upper Bollinger Band, and then finally closed below its upper Bollinger Band.
*Data from 1990 – present
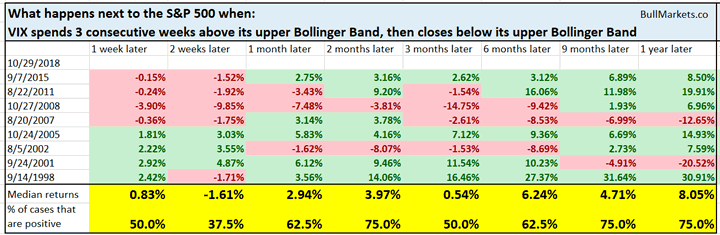
As you can see, the S&P 500 tends to perform decently over the next 2 months. The 2 loss cases (October 27, 2008 and August 5, 2002) occurred AFTER the stock market had crashed 40%+ and the economy was deep in a recession. Context matters, and in this case the context is very different.
Meanwhile, the Russell 2000 has finally broken its 6 week loss streak.
Here’s what happens next to the Russell (historically) when it breaks a 6 week loss streak.
*Data from 1987 – present
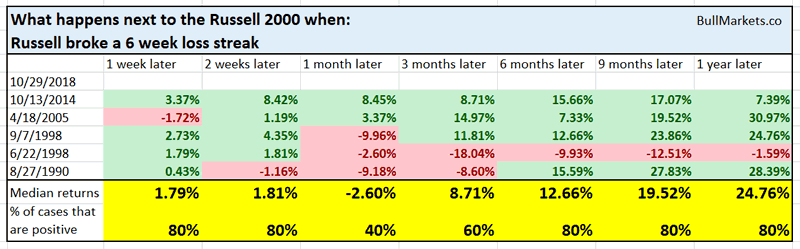
When this happens, the Russell tends to go up 6-12 months later.
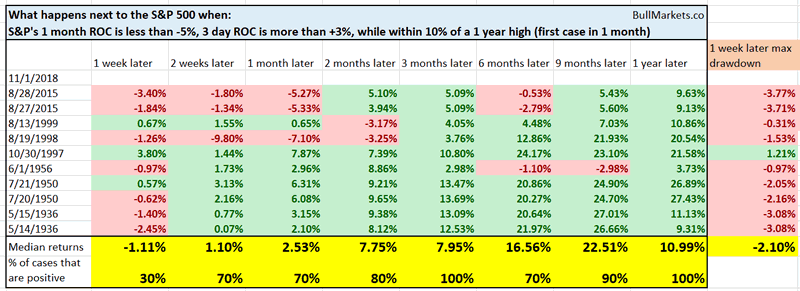
Over the past month the stock market made a very fast correction and also a strong bounce. As of last Thursday, the S&P’s 1 month rate-of-change was less than -5% (i.e. very quick correction) while the 3 day rate-of-change was more than +3% (i.e. very sharp bounce).
Source: Investing.com
When this happens, the stock market was always higher 3 months later.
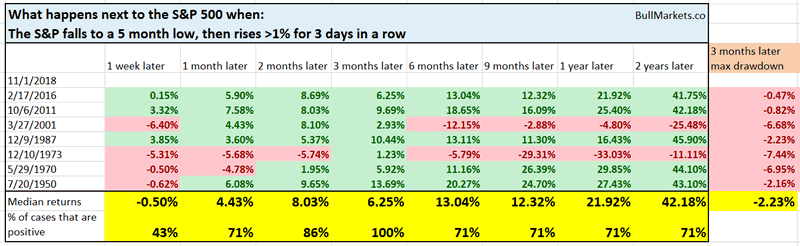
And as of last Thursday, the S&P went up more than +1% for 3 consecutive days, after falling to a 5 month low.
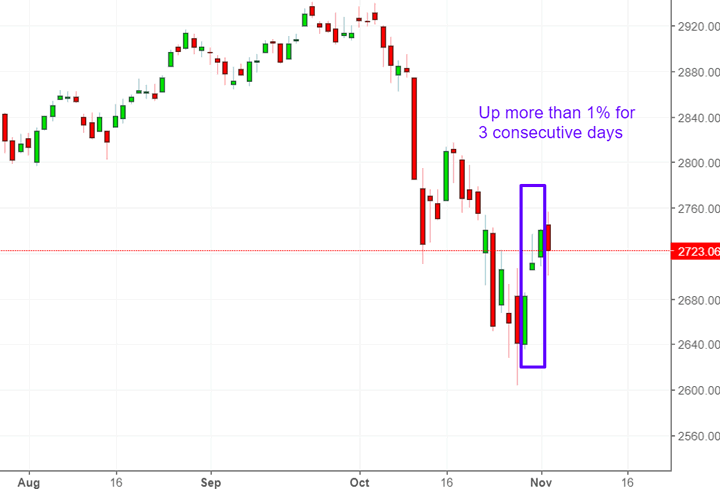
Source: Investing.com
Such strong reversals can lead to short term weakness, but the medium term is bullish.
Last Wednesday’s “gap up” was also exceptionally strong. The S&P’s daily LOW on Wednesday was more than 0.7% above the previous day’s HIGH.
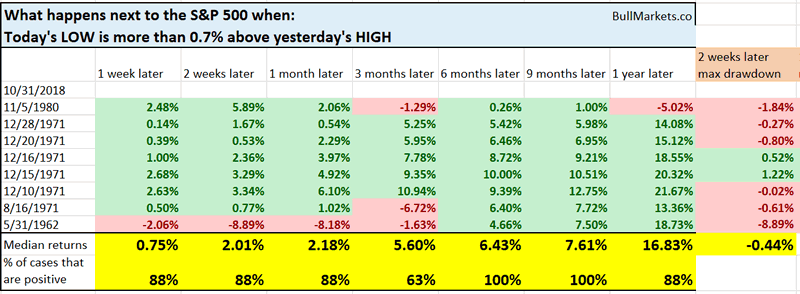
Such big “gap ups” are rare, and have always led to gains over the next 6-9 months.
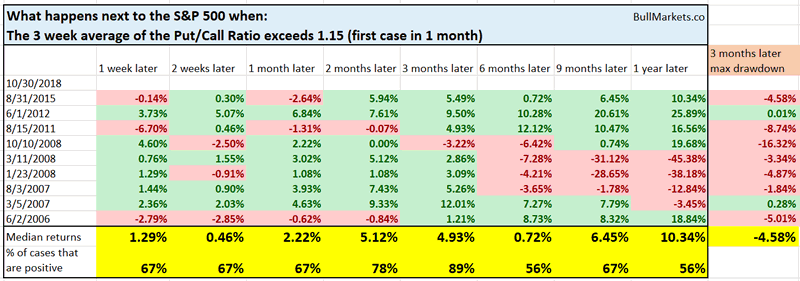
And as of last Tuesday, the stock market’s sentiment was extremely bearish. The Put/Call Ratio’s 3 week average had exceeded 1.15
Historically, this usually led to a bounce over the next 2-3 months.
*Data from 1995 – present
Short Term
The Short Term is mostly a 50-50 bet right now, although it’s unlikely that the stock market will go straight up from here right now.
Not many of these quick and sharp 10%+ corrections see a V-shaped recovery. Most of them see the stock market swinging around at the bottom before heading higher.
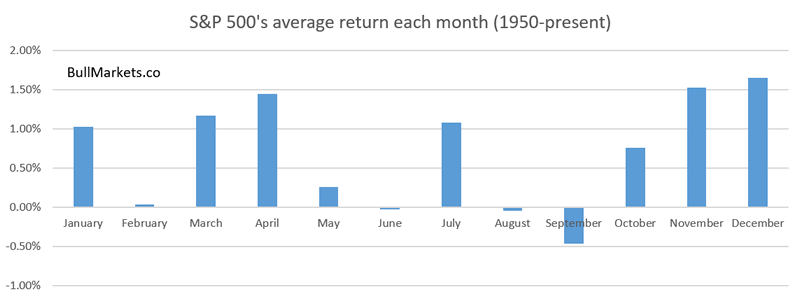
With that being said, the stock market is entering into a period of rather bullish seasonality from November – December.
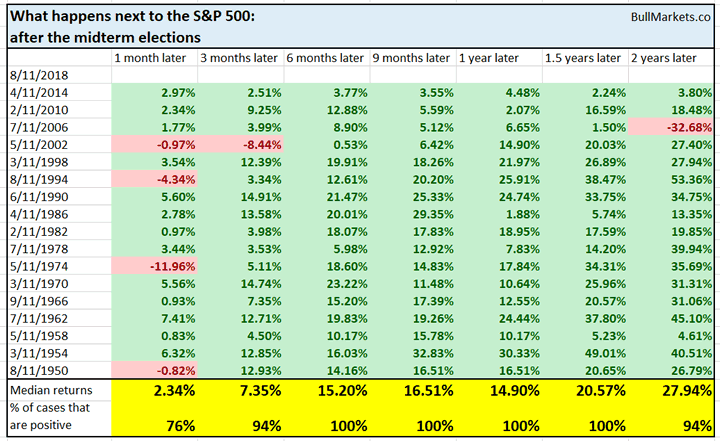
With midterm elections just around the corner, the stock market will probably rally from November to early 2019, even if there are short term declines along the way.
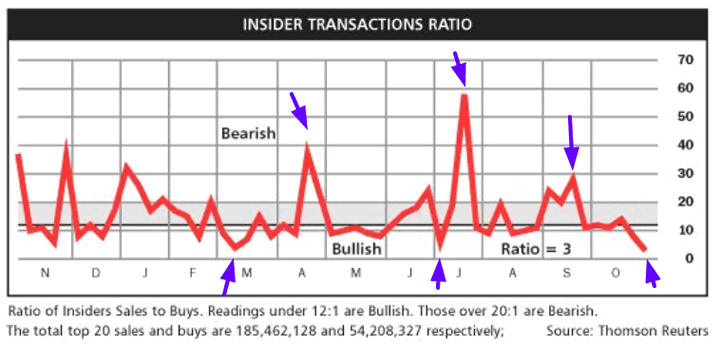
And lastly, it’s worth noting that there is almost no insider selling right now.
Conclusion
Here is our discretionary market outlook:
- The stock market’s long term is bullish. The bull market will probably peak in mid-2019.
- The stock market’s medium term is bullish (i.e. trend for the next 6-9 months). Even if this is the start of a bear market, there will probably be a medium term rally (couple of months).
- The stock market’s short term is a mostly a 50-50 bet, although there is a slight bearish lean.
Our discretionary outlook is usually, but not always, a reflection of how we’re trading the markets right now. We trade based on our clear, quantitative trading models, such as the Medium-Long Term Model.
Members can see exactly how we’re trading the U.S. stock market right now based on our trading models.
Click here for more market studies
By Troy Bombardia
I’m Troy Bombardia, the author behind BullMarkets.co. I used to run a hedge fund, but closed it due to a major health scare. I am now enjoying life and simply investing/trading my own account. I focus on long term performance and ignore short term performance.
Copyright 2018 © Troy Bombardia - All Rights Reserved
Disclaimer: The above is a matter of opinion provided for general information purposes only and is not intended as investment advice. Information and analysis above are derived from sources and utilising methods believed to be reliable, but we cannot accept responsibility for any losses you may incur as a result of this analysis. Individuals should consult with their personal financial advisors.
© 2005-2022 http://www.MarketOracle.co.uk - The Market Oracle is a FREE Daily Financial Markets Analysis & Forecasting online publication.