US Elections May Trigger Major Stock Market Bottom – PART II
Stock-Markets / Stock Markets 2018 Oct 31, 2018 - 08:57 AM GMTBy: Chris_Vermeulen
The clock is ticking on our expected bottom formation and now is the time for skilled traders to begin to position their trades for the remainder of 2018 and early 2019. We detailed why we believe the US equities markets have already, or are currently, hammering out a price bottom after the last few weeks downside price activity. In part one of this article, we illustrated how the US elections cycles are really more of a global geopolitical event and often drive price rotation in the months prior to these elections. Please take a minute to read Part 1 of this two-part research post if you have not already done so.
In this second part of our US election research post, we are going to continue to review topics that were previously discussed as well as highlight how certain market segments appear to be setting up for a massive price reversal. So, let’s get started.
Keeping in mind the information we presented in Part 1 of this research, our hypothesis is that US elections cycles present a huge opportunity for skilled traders by creating volatility and rotation in price and many segments of the global markets. Over the past 3+ years, we have been writing about what we call a “capital shift” that has been taking place. Near the end of the Obama presidency (2015 & 2016), a number of factors were taking place in the US and global economy. First, the start of the new Presidential Election cycle events was already working through the news cycles – the selection of the candidates. Second, China had recently instilled capital controls to prevent a capital outflow issue and to support their bulging economy locally. Lastly, emerging markets and oil had collapsed, putting incredible pressures on certain foreign markets to support their local economies and find suitable sources for their investments as currencies started to collapse as well.
This event, that actually started in 2014 or so, initiated what we call the “capital shift” where cash quickly moved out of risky investments and hunted for and deployed within safer investment structures – the US and major global equity markets. In particular, we believe the US Technology, healthcare and biotech sectors were huge beneficiaries of these new capital investments and we believe as these share prices started increasing, more and more capital kept flowing into these sectors – like a dog chasing his tail. The price advances seem to never end… until the 2016 election cycle event. This caused the entire global equities markets to pause for a few months as Hillary Clinton and Donald Trump battled it out.
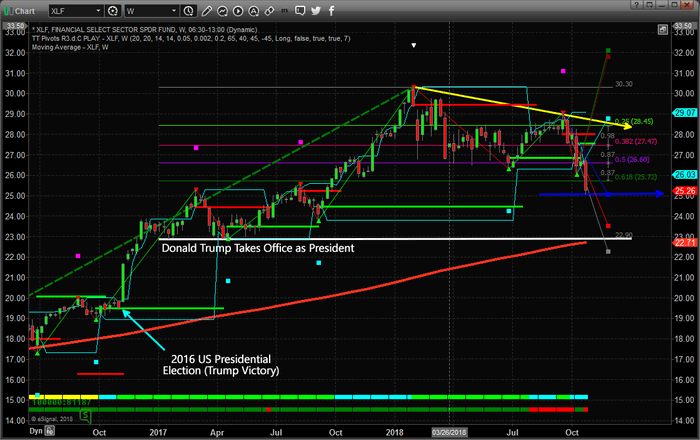
Within this Weekly XLF chart, you can see how quickly after the US presidential election the Financial Sector sprung back to life – rallying nearly 20% within the 6 weeks following the Trump victory. This is a massive move for investors and traders. Skilled traders know to watch for these setups within election cycle events and this is the one reason we are writing this article for you today – to keep you informed that massive trading opportunities exist over the next 3~6+ weeks.
You can also see from this chart that by the time President Trump was sworn into office, the XLF price rotated within a 12~15% range before the new Trump policies and objectives began to be announced (near October 2017). At that time, the Financial sector skyrocketed again by another 35~40% – reaching a peak near $30.60 in January 2018. Pay attention to what we are trying to suggest to you as skilled traders, we are about 7~10 days away from a US mid-term election that will likely present opportunities like this again and we want all of you to understand the huge potential for very big price swings that are setting up right now. The XLF is trading near $25.25 and any upside potential to near recent highs would reflect a 12~15% price increase (or more). Should this mid-term election result in increased fear in the markets and a related price downturn, the nearest support highlighted by the WHITE line on this chart would reflect a -9% price decrease. Either way, up or down, the potential for the Financial sector to generate big gain is already there – waiting for us to execute.

As we stated in Part 1, our predictive modeling systems have been suggesting that a major price bottom formation will setup sometime between November 8 and November 12 and that price will rally throughout the end of 2018 as the Santa Rally kicks into gear again. The recent GDP numbers support this outcome as the US economy is knocking out 3.5~3.8% levels every quarter.
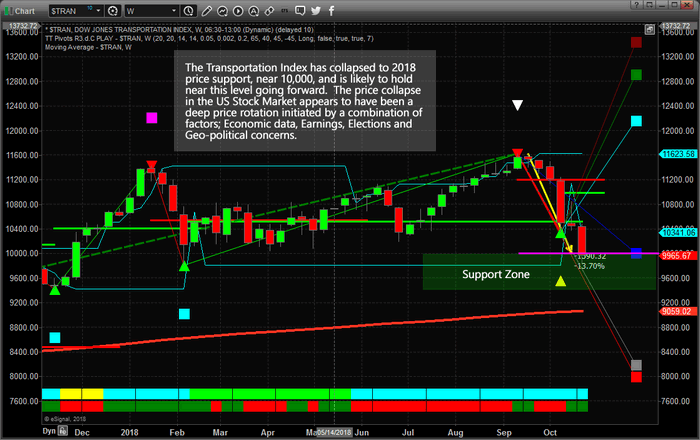
We found the move in the Transportation Index very interesting in terms of relative price analysis. The $TRAN index rotated lower to meet our expected 5~8% targets, then blew past those levels last week to drop to below our BLUE projected Fib extension level – then recover. The recent new low in the $TRAN will set up a new Fibonacci price bottom and will establish new upside price targets as the bottoms forms and price stalls headed into the mid-term elections. We know this will occur as Fibonacci price theory operates on price peaks and valleys and we expect a continued price bottom to form over the next 7 to 10 Daily trading sessions. Once this price low formation is established and confirmed, our price modeling systems will generate new upside projection levels that will help us understand how far and fast price will attempt to move higher.

Major election cycles happen every two years in the US and are real opportunities for skilled traders. The first rule is that you should be very cautious as major election events begin to unfold – such as major Presidential election cycles. Understand that these events can, and often do, sew fear and uncertainty into the markets and could be predicted by some very interesting price swings in commodities, foreign markets, currencies or equities. As the election cycle continues, prepare for the opportunities that will unfold and make sure you watch the commodities, like Gold, Silver, Oil and the US Dollar, for signs of contagion, capitulation, and fear. We believe our September 17th analysis of a price bottom setting up near or before November 12 is still the valid outcome of this election cycle and we believe there will be huge opportunities for skilled traders immediately after this US election event.
Be prepared and don’t miss this chance to really capture some great trading opportunities.
Our predictive modeling systems called this move nearly 4 weeks in advance and now they are calling for a bottom to set up near November 10th and a price rally to resume throughout the rest of 2018. If you want to find out how these incredible tools can help you find and execute better trades, then visit www.TheTechnicalTraders.com to learn more.
Chris Vermeulen
www.TheTechnicalTraders.com
Chris Vermeulen has been involved in the markets since 1997 and is the founder of Technical Traders Ltd. He is an internationally recognized technical analyst, trader, and is the author of the book: 7 Steps to Win With Logic
Through years of research, trading and helping individual traders around the world. He learned that many traders have great trading ideas, but they lack one thing, they struggle to execute trades in a systematic way for consistent results. Chris helps educate traders with a three-hour video course that can change your trading results for the better.
His mission is to help his clients boost their trading performance while reducing market exposure and portfolio volatility.
He is a regular speaker on HoweStreet.com, and the FinancialSurvivorNetwork radio shows. Chris was also featured on the cover of AmalgaTrader Magazine, and contributes articles to several leading financial hubs like MarketOracle.co.uk
Disclaimer: Nothing in this report should be construed as a solicitation to buy or sell any securities mentioned. Technical Traders Ltd., its owners and the author of this report are not registered broker-dealers or financial advisors. Before investing in any securities, you should consult with your financial advisor and a registered broker-dealer. Never make an investment based solely on what you read in an online or printed report, including this report, especially if the investment involves a small, thinly-traded company that isn’t well known. Technical Traders Ltd. and the author of this report has been paid by Cardiff Energy Corp. In addition, the author owns shares of Cardiff Energy Corp. and would also benefit from volume and price appreciation of its stock. The information provided here within should not be construed as a financial analysis but rather as an advertisement. The author’s views and opinions regarding the companies featured in reports are his own views and are based on information that he has researched independently and has received, which the author assumes to be reliable. Technical Traders Ltd. and the author of this report do not guarantee the accuracy, completeness, or usefulness of any content of this report, nor its fitness for any particular purpose. Lastly, the author does not guarantee that any of the companies mentioned in the reports will perform as expected, and any comparisons made to other companies may not be valid or come into effect.
Chris Vermeulen Archive |
© 2005-2022 http://www.MarketOracle.co.uk - The Market Oracle is a FREE Daily Financial Markets Analysis & Forecasting online publication.


