


US Elections May Trigger Major Stock Market Bottom
Stock-Markets / Stock Markets 2018 Oct 30, 2018 - 06:23 AM GMTBy: Chris_Vermeulen

 Almost like clockwork, our research team, at Technical Traders Ltd., predicted on September 17) the US stock market would turn lower and attempt a 5~8% downside move on or after September 21 headed into the US mid-term elections. Our analysis of the potential downside move was related to our price modeling systems expectations that a common predicted downside target existed between -5% and -8%. Our researchers did not believe the markets would fall much below -10% before hammering out a price bottom and finding support.
Today, we wanted to alert you to the fact that we are just 7~10 days away from the US mid-term elections and if our predictions hold true, we will be establishing a price bottom in the US stock markets over the next 5+ trading days and begin a new upside price rally fairly quickly after the election results are known. We could interpret this as “a period of uncertainty that is mixed with economic and news data” which results in investors pulling out of the markets ahead of these types of global events. In all reality, the US elections are really a global event for many investors. Policies, regulations, taxes, objectives, and execution become a very big question for many as these elections take place. Hundreds of billions of dollars are exposed to risk in the weeks headed into US elections and, thus, global investors and traders are always cautious headed into a major US election.
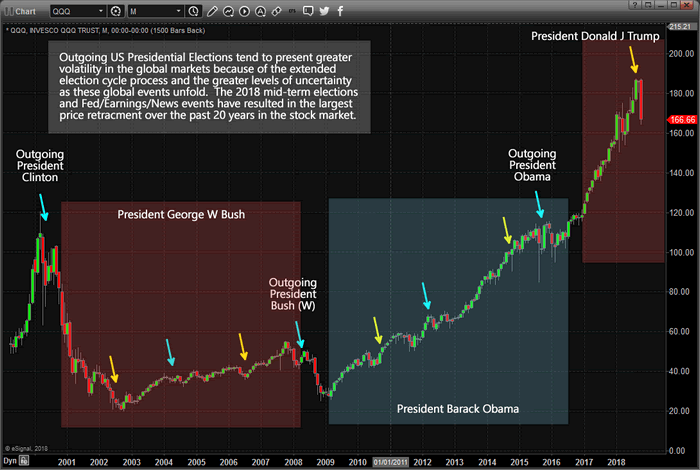
Our theory is that this phenomenon has become even more volatile in recent years and global political ideals have become further polarized. We believe when a sitting US president that has served for two terms is leaving office, far greater volatility enters the global markets typically. We believe that mid-term US elections, depending on the political climate at the time, may or may not reflect in broad global market concerns and volatility. We’ve highlighted major US Presidential elections and US Mid-Term elections on the chart below so you can see how volatility and price rotation increase or decrease depending on the political climate and uncertainty associated with these US elections. We’ve highlighted 6+ months (or longer) before Presidential elections and a few months before mid-term elections.
The current election event, November 6, 2018, is somewhat unique as it also coincides with the US Fed having raised FFR rates considerably over the past 2+ years as well as after a dramatic price increase in the US equities markets following the election of President Donald J. Trump. You can clearly see from the chart below that the QQQ has increased by nearly $80+ over the past two years while that same $80 increase existed over the entire Obama stock market recovery (8 years). This reflects the amount of increased volatility and activity that is within the current global capital market.
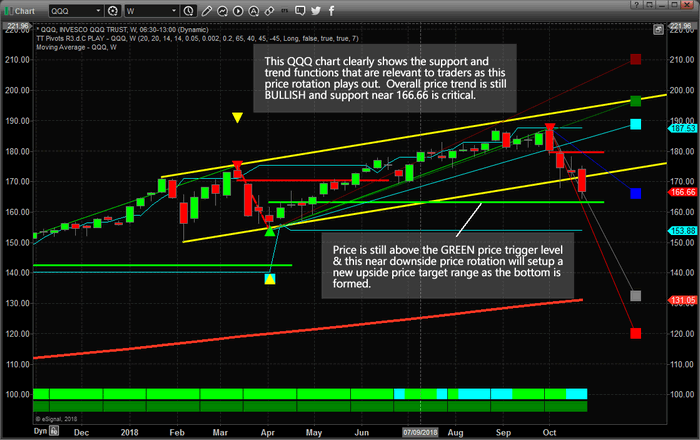
This QQQ Weekly chart highlights what we believe to be the core elements of this election cycle rotation. On this Weekly chart, the overall price trend is still BULLISH (see the DARKER GREEN blocks near the bottom of the chart) and the bullish price trigger level near $163 is still valid. Yes, the shorter term price trend is currently BEARISH and has been so since the week of October 8. You can see the bearish price trigger level near $179 (in red) that was recently breached and the downside price target level (in blue) near $166.
Our expectations from our predictions that the markets would be rotated lower by 5~8% were that the markets would move towards the lower YELLOW price channel level and stall near these levels (or just below these levels). We did not expect the extended price decline that was a result of earnings data and housing data being released last week. We still believe this move has already reached its downside objectives and is in the process of setting up a major bottom formation. We believe the extended move was an emotional price reaction to a hyper-election environment in the US and extended anticipation of caution in the global capital markets.
In the next segment of this research article, we’ll take a look at additional technical, price and modeling systems that support our belief of a major bottom formation setting up in the US equity markets and how election cycle events should be played for success. This current downside price rotation has extended to below our expected levels – much like a deeper “washout low” price formation. We continue to believe the next 7+ trading days will hammer out a bottom formation and that the US equities markets will resume an upside advance shortly after the elections are completed and throughout the remainder of 2018.
Please take a minute to visit www.TheTechnicalTraders.com to learn more about how we help our members find and execute success and how we can help you navigate these market rotations. Our predictive modeling systems called this move nearly 4 weeks in advance and now they are calling for a bottom to set up near November 10th and a price rally to resume throughout the rest of 2018. If you want to find out how these incredible tools can help you find and execute better trades, then visit www.TheTechnicalTraders.com to learn more.
Chris Vermeulen
www.TheTechnicalTraders.com
Chris Vermeulen has been involved in the markets since 1997 and is the founder of Technical Traders Ltd. He is an internationally recognized technical analyst, trader, and is the author of the book: 7 Steps to Win With Logic
Through years of research, trading and helping individual traders around the world. He learned that many traders have great trading ideas, but they lack one thing, they struggle to execute trades in a systematic way for consistent results. Chris helps educate traders with a three-hour video course that can change your trading results for the better.
His mission is to help his clients boost their trading performance while reducing market exposure and portfolio volatility.
He is a regular speaker on HoweStreet.com, and the FinancialSurvivorNetwork radio shows. Chris was also featured on the cover of AmalgaTrader Magazine, and contributes articles to several leading financial hubs like MarketOracle.co.uk
Disclaimer: Nothing in this report should be construed as a solicitation to buy or sell any securities mentioned. Technical Traders Ltd., its owners and the author of this report are not registered broker-dealers or financial advisors. Before investing in any securities, you should consult with your financial advisor and a registered broker-dealer. Never make an investment based solely on what you read in an online or printed report, including this report, especially if the investment involves a small, thinly-traded company that isn’t well known. Technical Traders Ltd. and the author of this report has been paid by Cardiff Energy Corp. In addition, the author owns shares of Cardiff Energy Corp. and would also benefit from volume and price appreciation of its stock. The information provided here within should not be construed as a financial analysis but rather as an advertisement. The author’s views and opinions regarding the companies featured in reports are his own views and are based on information that he has researched independently and has received, which the author assumes to be reliable. Technical Traders Ltd. and the author of this report do not guarantee the accuracy, completeness, or usefulness of any content of this report, nor its fitness for any particular purpose. Lastly, the author does not guarantee that any of the companies mentioned in the reports will perform as expected, and any comparisons made to other companies may not be valid or come into effect.
Chris Vermeulen Archive |
© 2005-2022 http://www.MarketOracle.co.uk - The Market Oracle is a FREE Daily Financial Markets Analysis & Forecasting online publication.