


Bitcoin Technical Analysis
Currencies / Bitcoin Oct 18, 2018 - 12:19 PM GMTBy: Austin_Galt

 Pattern – the downtrend since the spike high looks to have slowed to crawl and I believe it can continue to drift lower.
Fibonacci – price has been making its way through the angles which is some consolation for the bulls. After trading a bit further down I believe price can rally and eventually crack above the 88.6% angle which may provide some temporary resistance.
Weekly Chart
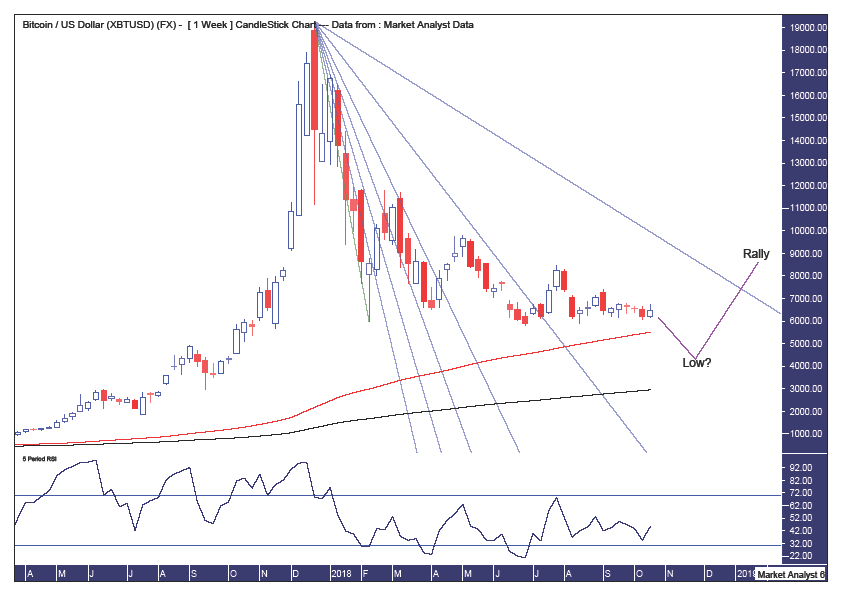
Moving average – in a bullish position and these averages should provide support and perhaps a low will occur somewhere around these averages. Perhaps somewhere in between??
RSI – a bullish divergence will likely form at the coming low.
Monthly Chart
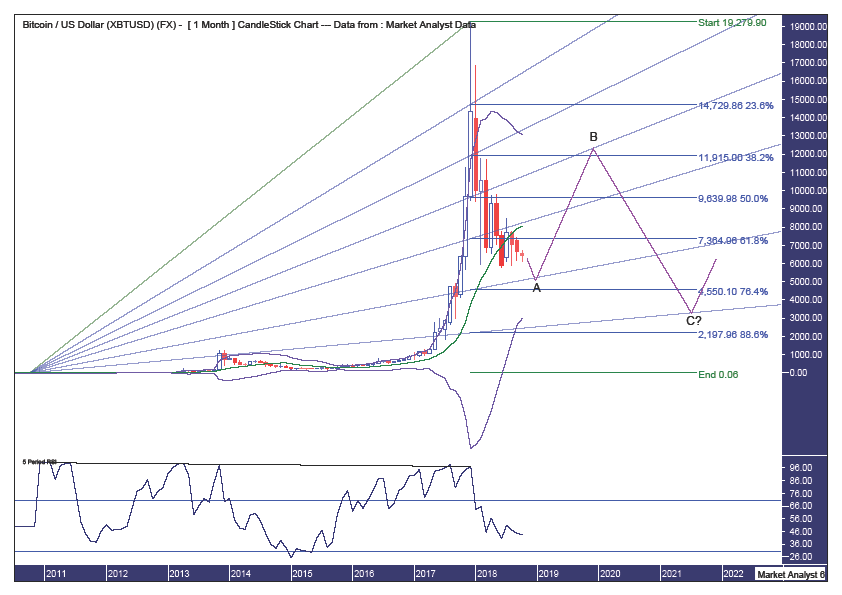
Pattern – I believe an ABC correction is in play with the final wave C low still a few years away. The move up into a wave B high will likely get the Bitcoin enthusiasts excited again and thinking a new massive bull trend is underway again. Not likely, in my opinion.
Bollinger Bands – price is now testing support from the middle band and I expect this support to kick in in the not too distant future, I doubt price will get down to the lower band on this move down. I favour the wave B high to be around resistance from the upper band with the final wave C low to be around support from the lower band. All in good time.
Fibonacci – I have used the all time low and high for this analysis and price is nearing some good support levels for a low being the 76.4% angle and the 76.4% retracement level at $4550. I favour the expected bear rally high (the wave B high) to get back up to around the 50% angle and the 38.2% retracement level at $11915. I favour the final wave C low to be around support from the 88.6% angle while the 88.6% retracement level at $2197 is not out of the question.
RSI – some major bearish divergences formed at the record high last year while this indicator is currently in weak territory and doesn’t look very promising from a bullish perspective.
Summing up – I believe price will trade a bit lower from here before embarking on a bear rally. I don’t expect new all time highs for many years to come.
By Austin Galt
Austin Galt has previously worked as a stockbroker and investment banker while studying technical analysis for over two decades. He is also the author of the book White Night: A Colombian Odyssey
Email - info@thevoodooanalyst.com
© 2018 Copyright The Voodoo Analyst - All Rights Reserved
Disclaimer: The above is a matter of opinion provided for general information purposes only and is not intended as investment advice. Information and analysis above are derived from sources and utilising methods believed to be reliable, but we cannot accept responsibility for any losses you may incur as a result of this analysis. Individuals should consult with their personal financial advisors.
Austin Galt Archive |
© 2005-2022 http://www.MarketOracle.co.uk - The Market Oracle is a FREE Daily Financial Markets Analysis & Forecasting online publication.