


Is this the Start of a Bear Market for Stocks?
Stock-Markets / Stock Markets 2018 Oct 16, 2018 - 10:46 AM GMTBy: Troy_Bombardia

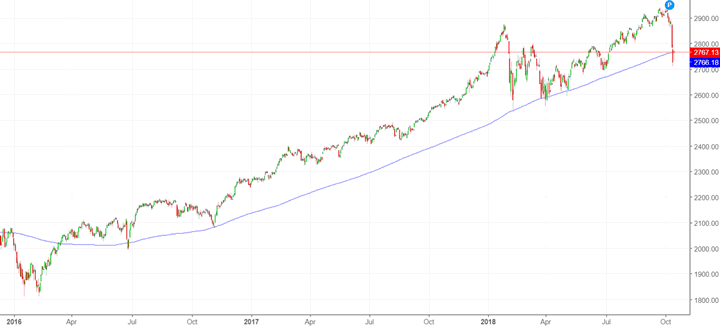
 Is this the start of a bear market for stocks? That’s probably what you’re wondering right now, with the S&P 500 sitting right ontop of its 200 daily moving average.
Here’s our long term, medium term, and short term outlook for the U.S. stock market. We focus on the long term and medium term. As U.S. stock market investors and traders, our job is to separate the signal from the noise.
As always, the economy’s fundamentals determine the stock market’s medium-long term outlook. Technicals determine the stock market’s short-medium term outlook. Here’s why:
- The stock market’s long term is bullish.
- The stock market’s medium term is bullish.
- The stock market will probably bounce and then retest the crash’s low or make a marginal new low in the short term.
Let’s go from the long term, to the medium term, to the short term.
Long Term
The Medium-Long Term Model will probably predict a “bear market is coming” sometime in mid-2019. Hence, our Long Term Outlook is:
- This is still a bull market.
- The bull market doesn’t have a lot of room left. Probably 1 more year.
Leading economic indicators continue to improve, which is long term bullish for the stock market & economy.
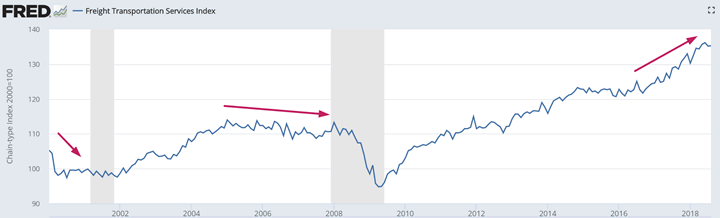
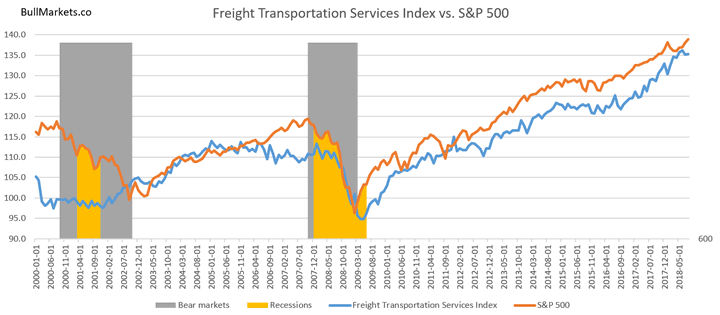
The Freight Transportation Services Index is still trending higher. Historically, this leading indicator tanked or swung sideways for many years before bear markets and recessions began.
Initial Claims and Continued Claims are still trending downwards. Historically, these leading indicators trended upwards before bear markets and recessions began.
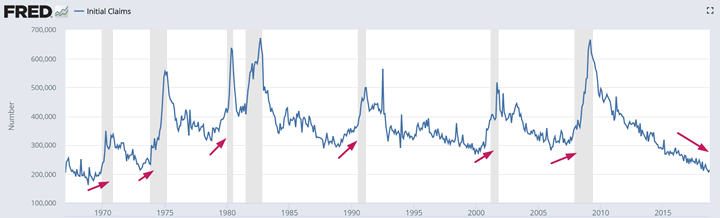
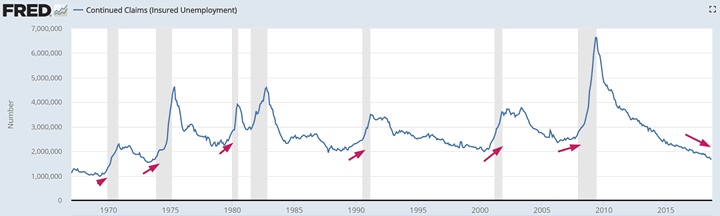
*With Initial Claims and Continued Claims so low, this bull market probably doesn’t have a lot of time left.
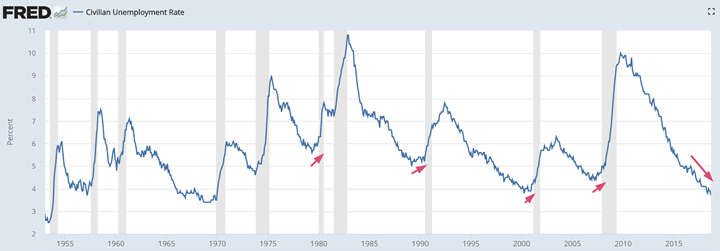
The Unemployment Rate continues to trend downwards, confirming the downtrend in Initial Claims and Continued Claims.
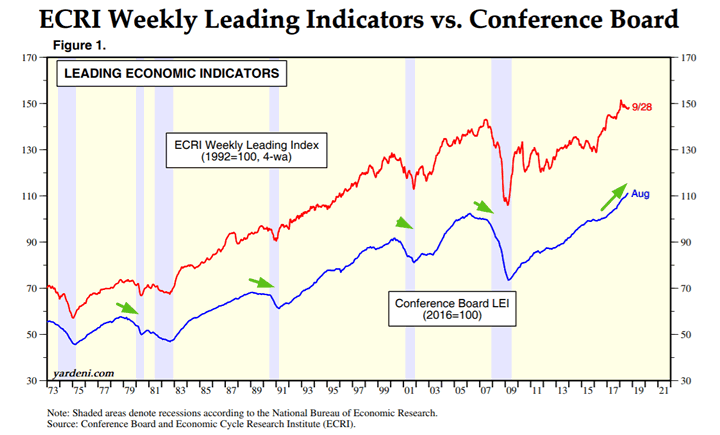
Meanwhile, the Conference Board’s Leading Economic Indicators index continues to trend higher. Historically, this leading indicator trended downwards before bear markets and recessions began.
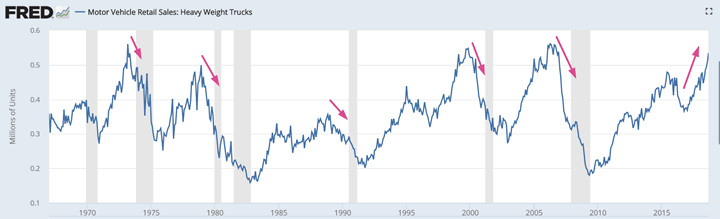
The latest reading for Heavy Truck Sales surged to new highs for this economic expansion. Historically, this leading indicator trended downwards before bear markets and recessions began.
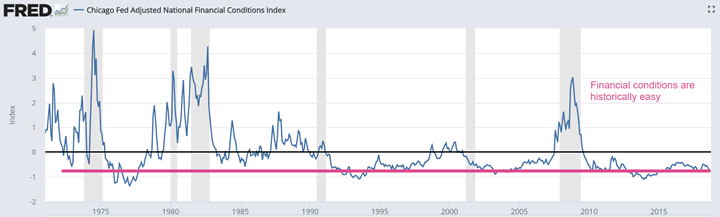
Despite the Fed’s rate hikes, financial conditions are still extremely loose…
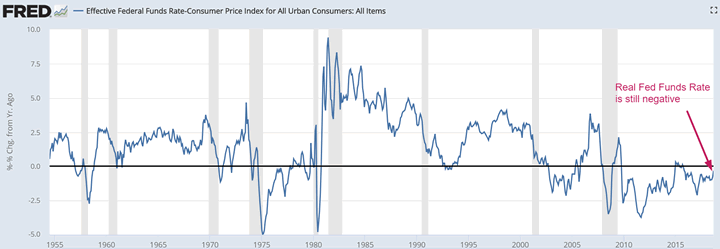
…which is probably because real, inflation-adjusted interest rates are still negative.
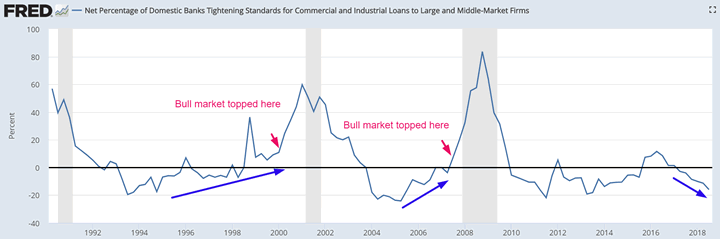
Banks’ lending standards are easing even more. Historically, lending standards tightened before bear markets and recessions began.
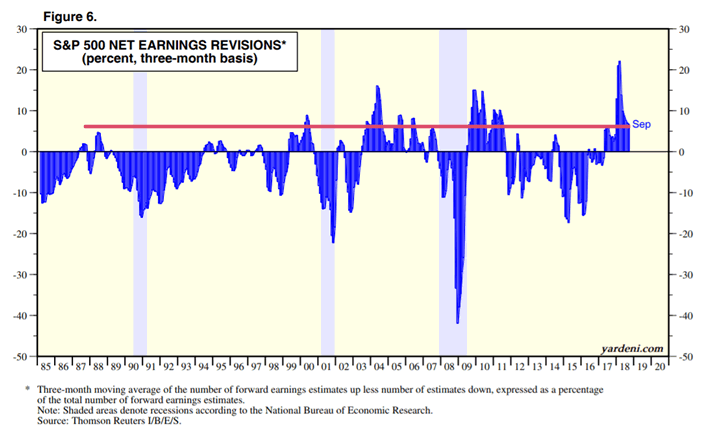
And lastly, net earnings revisions are still positive.
The S&P 500’s Net Earnings Revisions turns negative before economic recessions and equity bear markets begin. Net Earnings Revisions is far from negative right now. A bear market is not imminent. HOWEVER, you can see that this data is trending downwards. It will likely turn negative in 2019.
Medium term: technical signs that September 2018 was not the bull market’s top
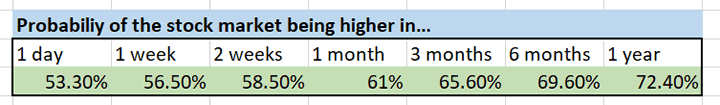
*Here’s the random probability of the stock market going higher on any given day.
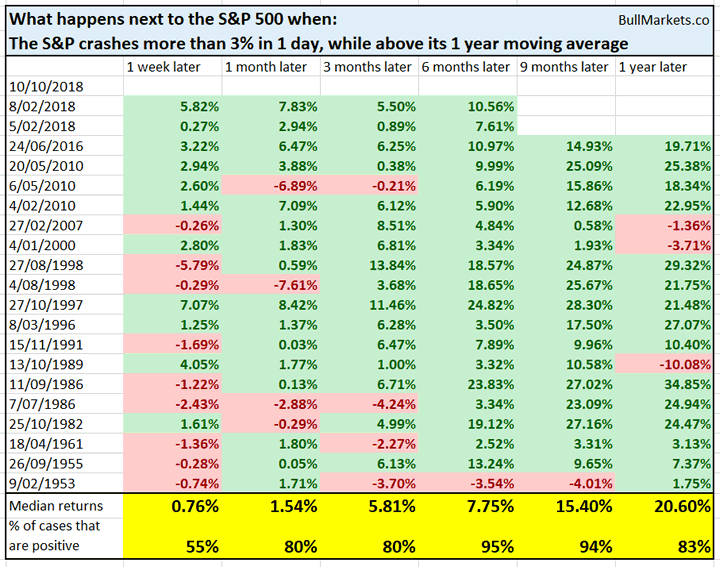
The S&P crashed more than -3% in 1 day last Wednesday, while still above its 1 year moving average (252 trading days). Historically, the stock market almost always went higher 6-9 months later.
Last Wednesday-Thursday’s crash wasn’t huge in % terms, but it was huge in terms of standard deviations.
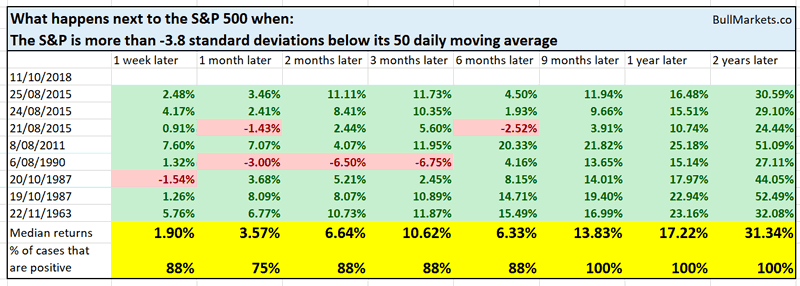
Last Thursday, the S&P 500 crashed more than -3.8 standard deviations below its 50 daily moving average. Historically, the stock market was always higher 9-12 months later.
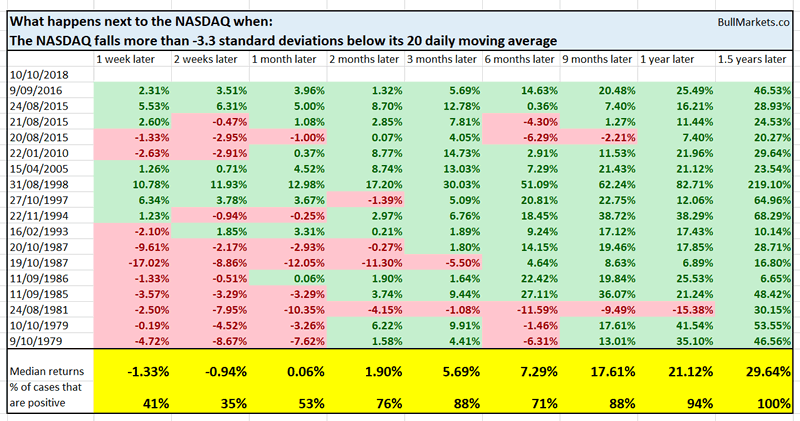
Similarly, as of last Wednesday, the NASDAQ crashed more than -3.3 standard deviations below its 20 daily moving average. This never occurred at the top of a bull market (historically).
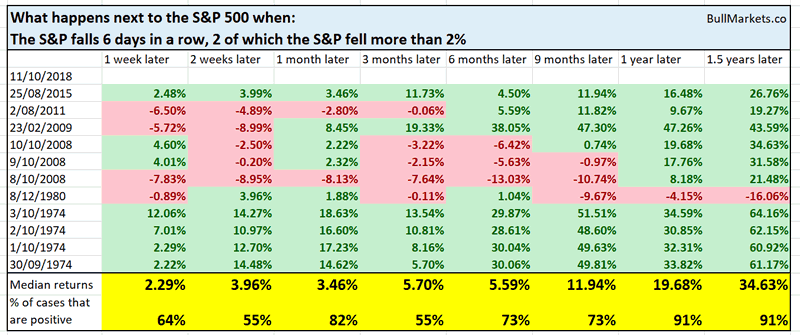
As of last Thursday, the U.S. stock market had fallen 6 days in a row, with 2 of those days seeing a >2% loss. Similar historical situations saw the stock market up almost every time 1 year later.
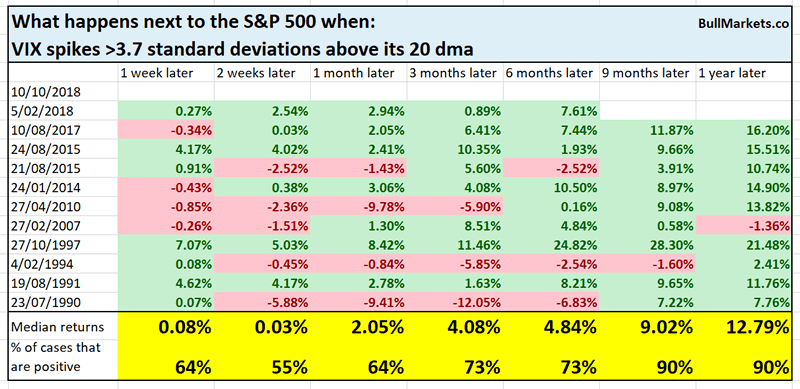
Meanwhile, VIX spiked more than 3.7 standard deviations above its 20 dma (as of last Thursday). Historically, this never occurred during the start of a bear market. Why?
Because before a bear market, VIX is already extremely elevated. Volatility expands during the final rally of a bull market. Volatility was extremely low from May – September, which suggests that wasn’t the last rally of this bull market.
*You can see that in the worst case scenario, this happened in February 2007, 8 months before the bear market started in October 2007.
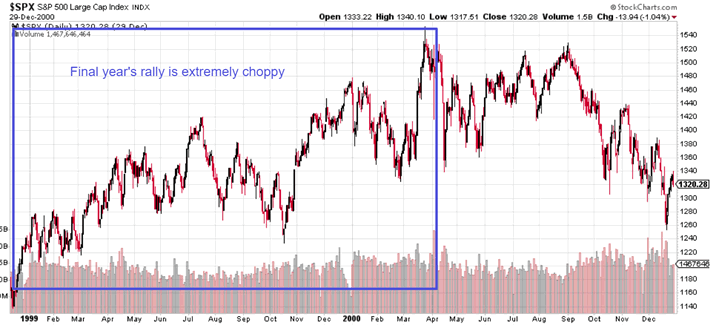
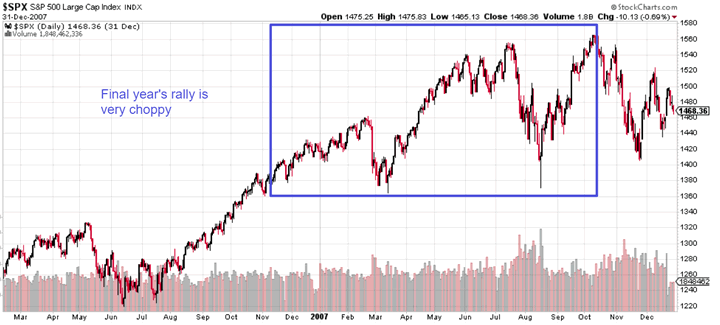
These kind of “flash crashes” happen every now and then. They’re typical of the final year before a bull market top.
As you can see, the U.S. stock market was very choppy before the 2000 and 2007 tops.
Short Term
Late-September to the end of October is the “blackout period” for stock buybacks. A “blackout period” = 5 weeks before an earnings report during which companies aren’t allowed to buy back their stocks.
*Earnings season is in the second half of October.
As you probably know, share buybacks have SOARED this year, putting a floor under the stock market. With the absence of share buybacks right now, the stock market is experiencing short term weakness. Once buybacks resume in November…. you put 2 and 2 together.

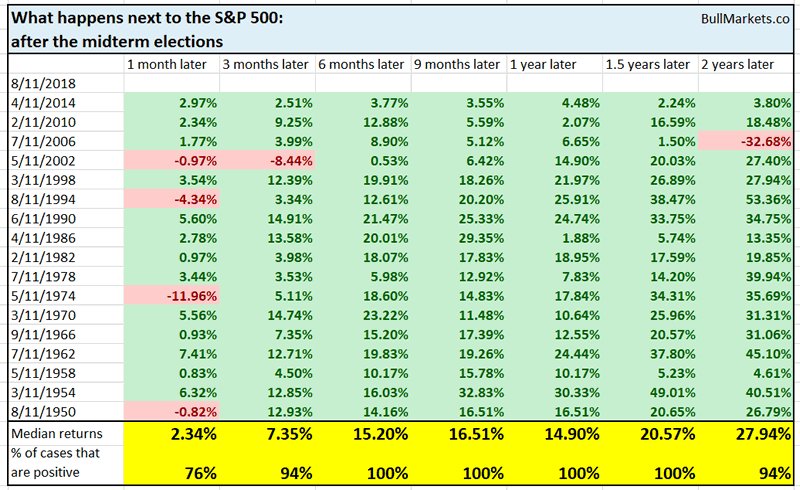
Moreover, remember that the 1 year after midterm elections tends to be extremely bullish for the stock market.
With that being said, these types of crashes typically see a retest or marginal new low (vs. the initial crash’s low). Any weakness is likely to be short-lived, so remember to focus on risk:reward.
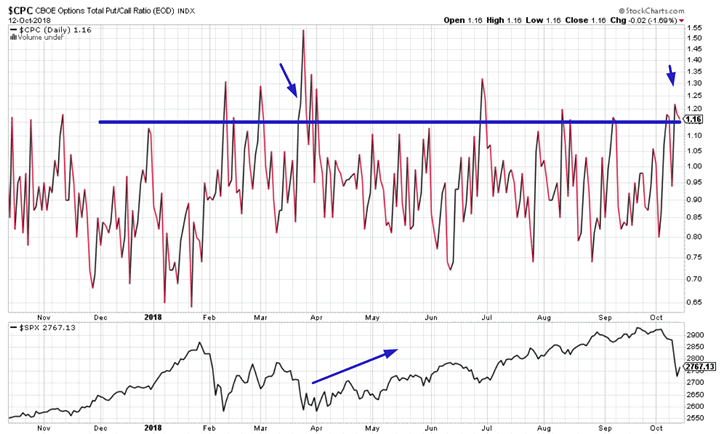
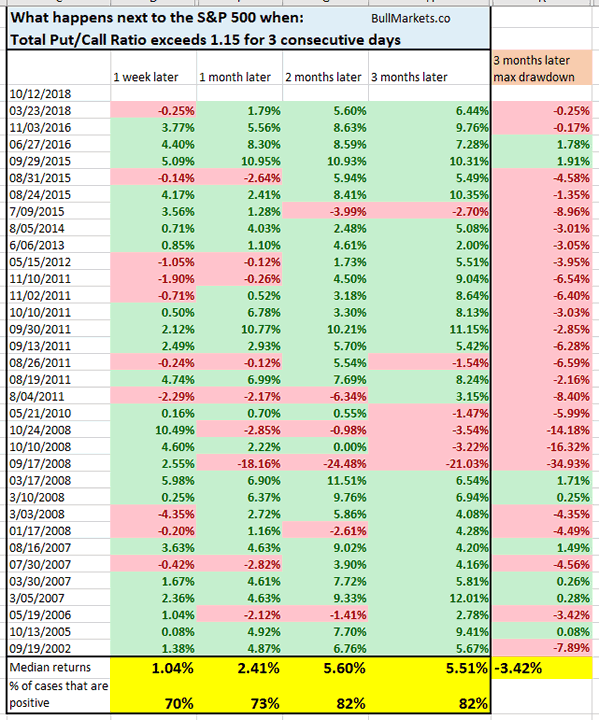
For starters, the Total Put/Call Ratio has remained elevated over the past 3 days. It has been above 1.15 for 3 consecutive days.
From 2003 – present, this meant that:
- The S&P had a median max drawdown of -3.4% over the next 3 months (i.e. lower low in the short term), but…
- 2-3 months later, usually went higher.
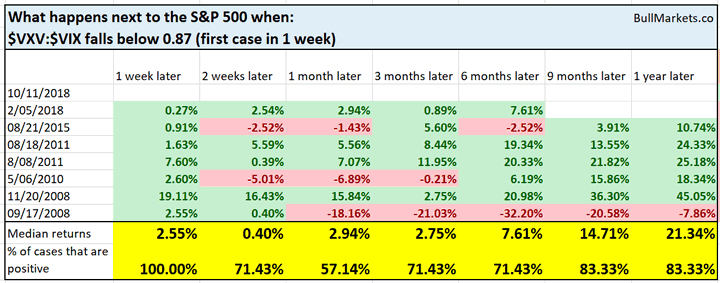
Meanwhile, the VXV:VIX ratio tanked below 0.87 last Thursday. This implies that VIX is in backwardation (VXV is the 3 month forward contract for VIX).
This is extremely low.
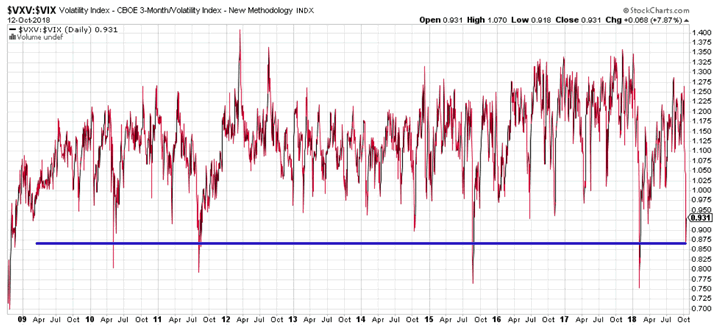
From 2007-present (available data period), the S&P’s forward returns were solid.
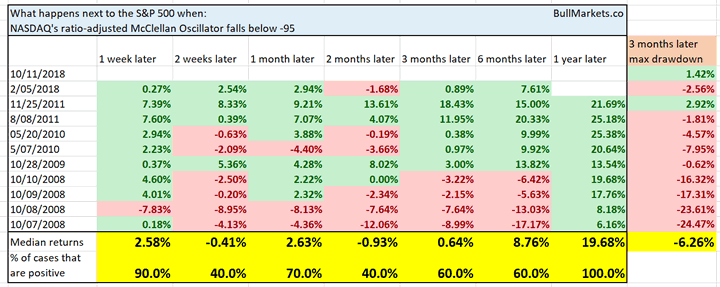
And lastly, note the NASDAQ’s McClellan Oscillator (ratio-adjusted), which was at -95 last Thursday.
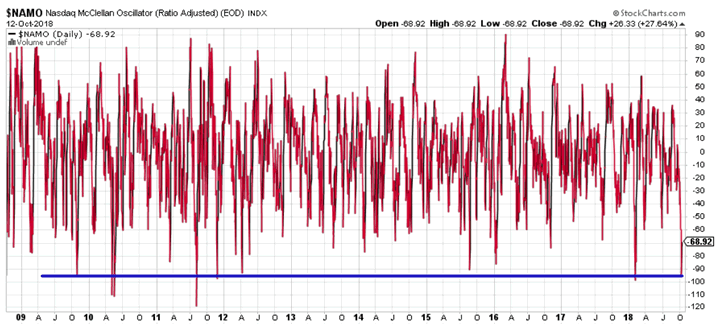
From 1998 – present, this usually led to
- A bounce, then…
- Some more short term downside over the next 2 weeks – 2 months.
- However, note that this never happened at the start of a bear market. Hence why the stock market was always up 1 year later.
Conclusion
- The stock market’s long term is bullish (even though this bull market probably has less than 1 year left).
- The stock market’s medium term is bullish.
- The stock market’s short term leans bearish. Expect a quick bounce and then a retest or marginal new low.
*We focus on the medium-long term, so take our short term market outlook with a grain of salt.
I am currently 67% long SSO (the S&P 500’s 2x leveraged ETF).
Click here for more market studies
By Troy Bombardia
I’m Troy Bombardia, the author behind BullMarkets.co. I used to run a hedge fund, but closed it due to a major health scare. I am now enjoying life and simply investing/trading my own account. I focus on long term performance and ignore short term performance.
Copyright 2018 © Troy Bombardia - All Rights Reserved
Disclaimer: The above is a matter of opinion provided for general information purposes only and is not intended as investment advice. Information and analysis above are derived from sources and utilising methods believed to be reliable, but we cannot accept responsibility for any losses you may incur as a result of this analysis. Individuals should consult with their personal financial advisors.
© 2005-2022 http://www.MarketOracle.co.uk - The Market Oracle is a FREE Daily Financial Markets Analysis & Forecasting online publication.