


Keep A Proper Perspective About Stock Market Recent Move
Stock-Markets / Stock Markets 2018 Oct 15, 2018 - 11:30 AM GMTBy: Chris_Vermeulen

 There has been quite a bit of information and opinion in the news recently regarding the recent downside price action in the US Equities markets. We’ve seen everything from “The sky is falling” to “The markets will rally into the end of the year”. If you’ve been following our research and analysis, you already know what we believe will be the likely outcome and if not – keep reading.
There are a number of key components of the global economy that are of interest currently; US Treasuries, Precious Metals, Emerging Markets, the European Union, Trade Issues and Capital Shifts.
When one considers the scope of the entire global market environment in terms of these individual issues, a fairly clear picture of what is really happening begins to take shape. Here is our summarized opinion of the current state of the global markets.
Capital is shifting (again) as the US Technology and high return sectors come under pressure. What happens, typically, in this type of environment is that capital moves away from risk (into cash or other suitable investments) as these sectors continue to weaken. Capital will return to these sectors once the risk factor diminishes or abates. Once the S&P fell below the 2915 level, a number of Sell Programs generated extensive downside pressure on the markets – in a way, creating a “wash-out low” price rotation fairly early in this move. Investors and capital will return into these sectors over time as they find support and wash out the extended volatility that is currently at play in the markets.
This capital shift is not unique to just the US markets though, there are other factors involved as well. News that Asian investors have been pulling out of the US Real Estate markets at a record pace, as well as the US Fed actions raising rates recently, has put additional pressure on the valuation/pricing levels in the US equities market. This is likely the reason why Gold and Silver rocketed higher last week. This pricing pressure, even though it was known prior to this downside price move, was not much of a concern for investors because the US stock market indexes didn’t show worry or concern for this issue. There was no real issue with downside pricing concerns. Once the S&P broke that 2915 level and the sell programs kicked in, this became a real issue for many.
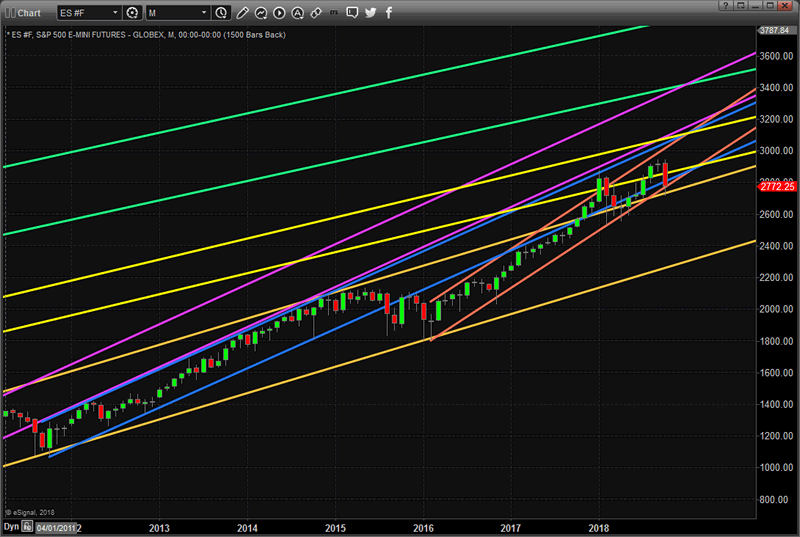
Yet, the longer-term perspective of this market has not changed much since early 2016. Take a look at this chart that highlights the pricing channels established in the S&P of the past 20 years. Each of these paired price channels originates at a low price point and reflect price range, slope and volatility as the progress further to the right. Notice how the original (GREEN) and most recent low-price range (GOLD) reflect a broader price range where volatility was higher and the slope is slightly lower than the shorter-term price channels. These reflect broader price support channels and help us to understand the core slope levels of price advance.
The shorter-term price channels (YELLOW, MAGENTA, BLUE & ORANGE) illustrate the “impulse channels” that are a result of localized or consensus advances. In other words, these types of advances are the result of some impetus event like Quantitative Easing, policy changes, US Election results or any combination of social & economic improvement factors. Price is always attempting to rotate as it attempts to establish new highs and lows.
We try to stress one key Fibonacci Price Theory component to all of our followers:
“Price MUST always attempt to seek out and establish new price highs or new price lows”
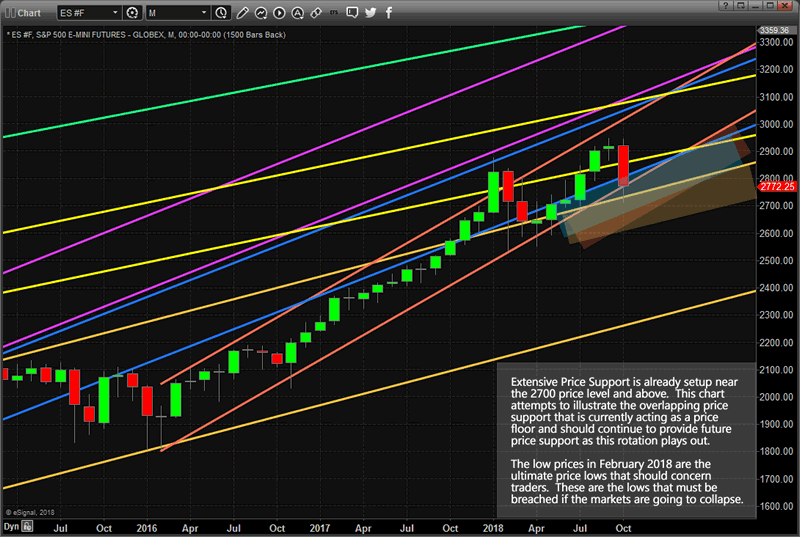
This one premise of Fibonacci Price Theory is so important to understand in the greater context of price movement. On a Daily chart, the recent downward price swing may look frightening, but on this Monthly chart, it falls right in line with the ORANGE price channels (which happen to be the most recent and most aggressively upward sloping price channels over the past 20+ years). Additionally, the price has advanced above the Upper GOLD price channel range and back into the BLUE price channel range in late 2017 and early 2018. At this point, price appears to be accelerating quite well and these new support levels (BLUE, ORANGE, and GOLD) are critical to understanding the basics of Fibonacci Price Theory.
So, as you listen to the talking heads on TV and in the news cycles, please understand that true price theory teaches us that “until price breaks recent critical lower or higher price levels, the market price will always attempt to rotate in an effort to seek out and establish new price highs or new price lows”.
This rotation is very healthy for the markets, overall, and this price rotation may, eventually, prove to be a retest of price support before a further advance. Our research team believes the low established near 2712 will likely continue to operate as critical price support as this price rotation continues to extend. Our research team also believe a new price advance phase will become established shortly after November 8~12. Our predictive modeling systems suggest a new price upswing will begin to take place after these November dates.
We urge all of our followers to visit our website, www.TheTechnicalTraders.com, to learn how our dedicated team of researchers and technical traders can assist you in finding and executing better trades, stay ahead of these markets move and properly prepare for the opportunities created by these swings in price. Additionally, take a minute to review some of our past research posts, www.TheTechnicalTraders.com/FreeMarketResearch/, to see how we predicted this downside price rotation over 3 weeks before it happened. It pays to have a dedicated team helping you understand and profit from these market price swings.
Chris Vermeulen
www.TheTechnicalTraders.com
Chris Vermeulen has been involved in the markets since 1997 and is the founder of Technical Traders Ltd. He is an internationally recognized technical analyst, trader, and is the author of the book: 7 Steps to Win With Logic
Through years of research, trading and helping individual traders around the world. He learned that many traders have great trading ideas, but they lack one thing, they struggle to execute trades in a systematic way for consistent results. Chris helps educate traders with a three-hour video course that can change your trading results for the better.
His mission is to help his clients boost their trading performance while reducing market exposure and portfolio volatility.
He is a regular speaker on HoweStreet.com, and the FinancialSurvivorNetwork radio shows. Chris was also featured on the cover of AmalgaTrader Magazine, and contributes articles to several leading financial hubs like MarketOracle.co.uk
Disclaimer: Nothing in this report should be construed as a solicitation to buy or sell any securities mentioned. Technical Traders Ltd., its owners and the author of this report are not registered broker-dealers or financial advisors. Before investing in any securities, you should consult with your financial advisor and a registered broker-dealer. Never make an investment based solely on what you read in an online or printed report, including this report, especially if the investment involves a small, thinly-traded company that isn’t well known. Technical Traders Ltd. and the author of this report has been paid by Cardiff Energy Corp. In addition, the author owns shares of Cardiff Energy Corp. and would also benefit from volume and price appreciation of its stock. The information provided here within should not be construed as a financial analysis but rather as an advertisement. The author’s views and opinions regarding the companies featured in reports are his own views and are based on information that he has researched independently and has received, which the author assumes to be reliable. Technical Traders Ltd. and the author of this report do not guarantee the accuracy, completeness, or usefulness of any content of this report, nor its fitness for any particular purpose. Lastly, the author does not guarantee that any of the companies mentioned in the reports will perform as expected, and any comparisons made to other companies may not be valid or come into effect.
Chris Vermeulen Archive |
© 2005-2022 http://www.MarketOracle.co.uk - The Market Oracle is a FREE Daily Financial Markets Analysis & Forecasting online publication.