


Stock Market Bottoms are a Process
Stock-Markets / Stock Markets 2018 Oct 15, 2018 - 10:22 AM GMTBy: Troy_Bombardia

What a roller coaster day on Friday for the U.S. stock market. The S&P went up and down near its 200 day moving average, closing right on top of this line.
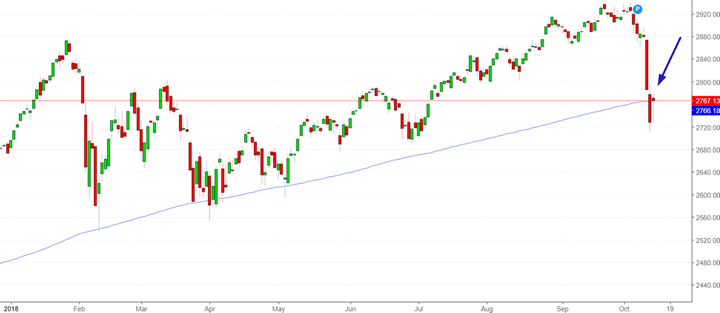
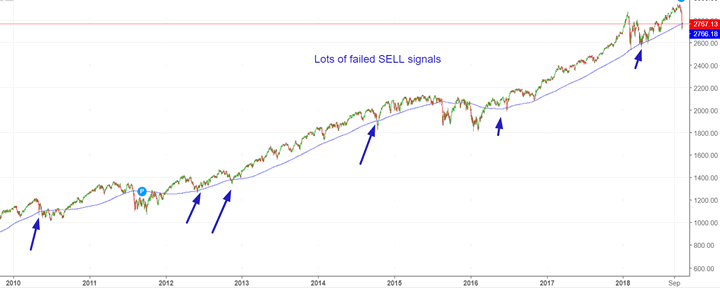
The 200 dma isn’t as important as you think it is. Breakdowns below this “support” have a LOT of false sell signals.
- The medium term risk:reward is very bullish.
- The short term risk:reward is mixed (because bottoms are a choppy process), but it leans bullish right now.
Today I want to emphasize on this point: bottoms are a choppy process. Here’s how these post-crash bottoms usually (but not always) work.
- Stocks initially crash.
- Stocks bounce.
- Stocks retest or make a marginal new low. That’s the real bottom.
In other words, there’s usually a retest (but not always, as seen in October 2014).
With that being said, let’s get into today’s market studies.
Gap up on the OPEN
The S&P 500 gapped up more than 1.5% on today’s OPEN (vs. yesterday’s CLOSE). From 1962 – present, this has only happened 3 other times.
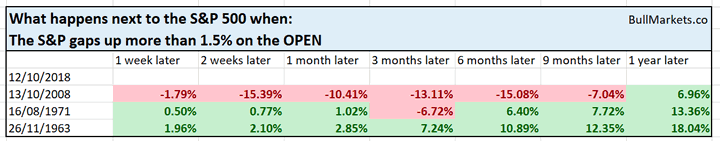
As you can see, even in the worst case scenario (2008), this came close to marking a medium term bottom in the S&P 500. 1 year later, the stock market went up in all 3 cases.
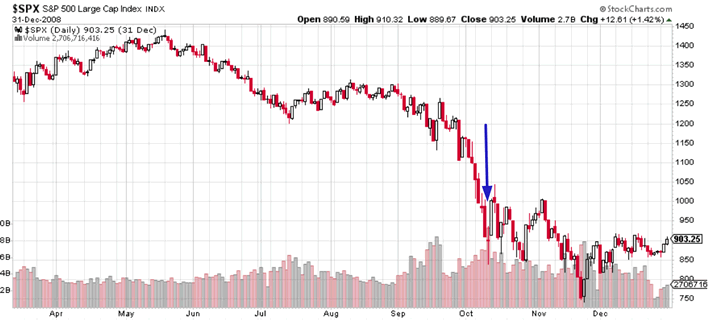
Why are these cases so rare? Because in a real bear market like 2008, the stock market tends to gap down on the open instead of gapping up.
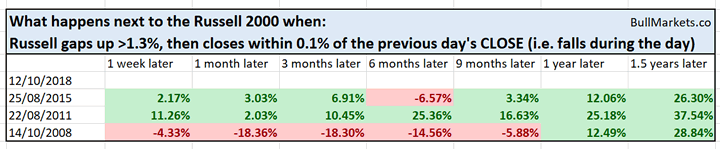
Meanwhile, the Russell 2000 (small caps index) gapped up more than 1.3% this Friday, then fell and closed within 0.1% of yesterday’s close.
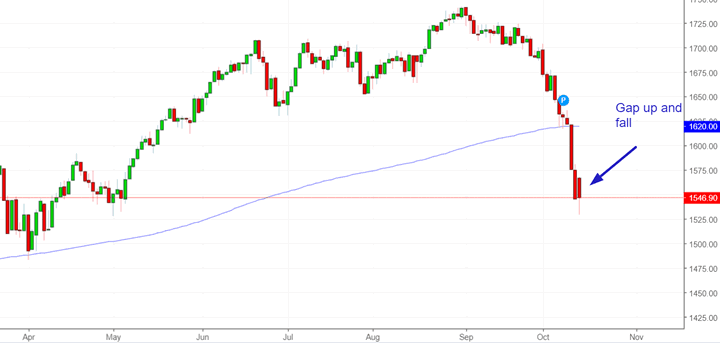
From 1987-present, this is rare. Some trader think it’s a bearish sign of “non-confirmation” because it’s a “failed bounce”. It isn’t.
Medium term risk:reward favors the bulls
While bottoms are a process, the medium term risk:reward certainly favors the bulls.
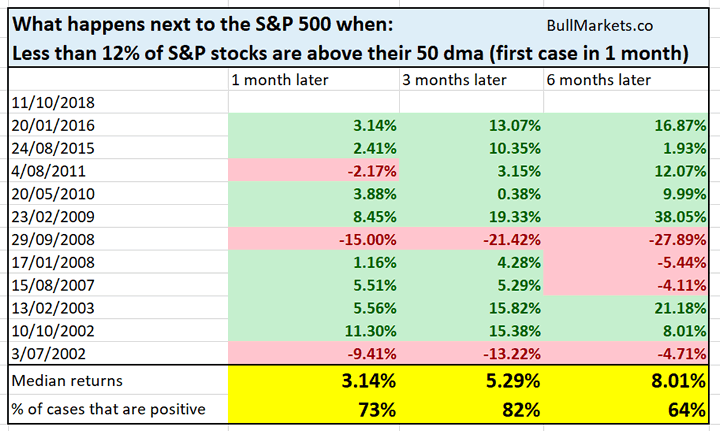
In terms of breadth, only 11% of S&P 500 stocks were above their 50 day moving average on Thursday. Data on this series is limited (2002-present). However, we can see that this is generally bullish for the stock market in the next 1-3 months.
The only real bearish cases were in 2008 and 2002, AFTER the stock market had already crashed 30%+.
Meanwhile, the S&P 500 had a very interesting pattern this week. It crashed >2% on Wednesday, >2% on Thursday, and made an “inside day today”.
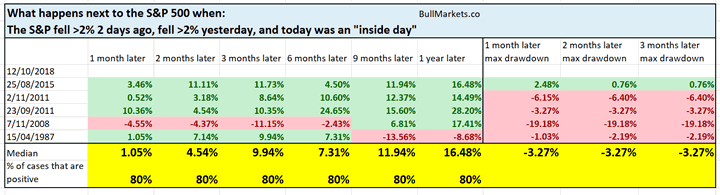
From 1950-present, here’s what the S&P 500 did next. Bullish.
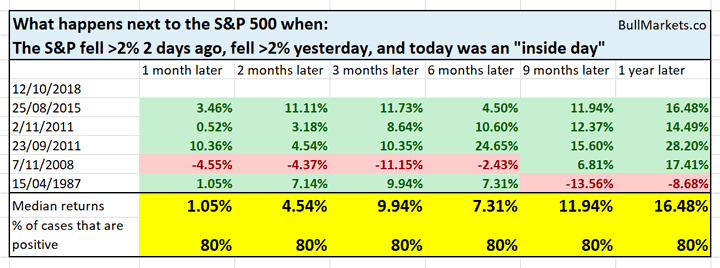
You can see that the median max drawdown over the next 3 months was 3.2%
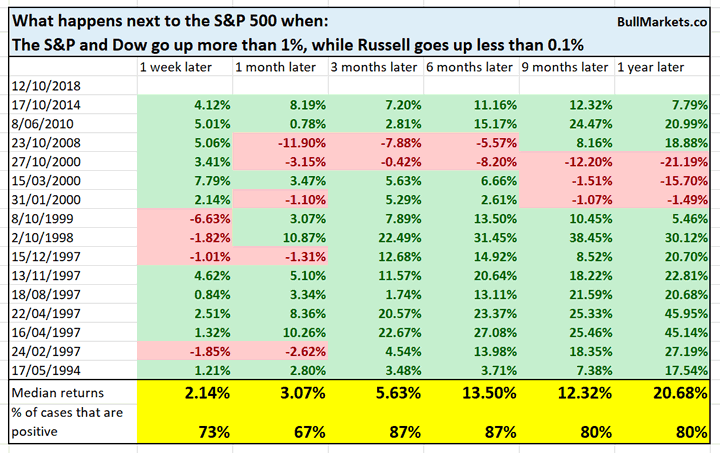
It’s also worth noting that small caps (Russell 2000) was much weaker than large caps today. Both the S&P and Dow went up more than 1%, while the Russell went up less than 0.1%.
Is this a sign of bearish non-confirmation? From 1991 – present, not really. 3-6 months later, the S&P was higher 87% of the time.
Short term choppiness
While the medium term outlook is bullish, the short term is mixed. Market bottoms usually involve a lot of back and forth swings.
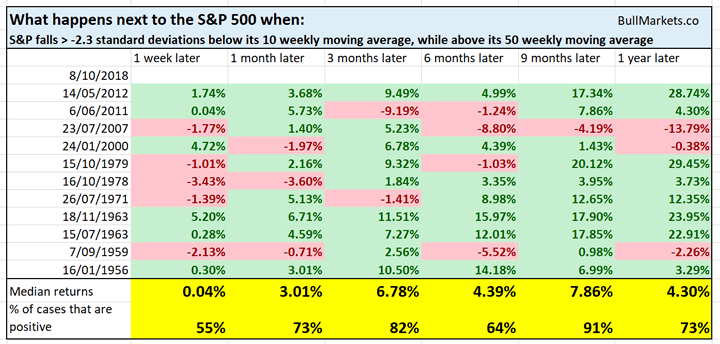
Here’s a very interesting scenario. On a weekly bar chart, the S&P is now more than -2.3 standard deviations below its 10 weekly moving average, while it is still above its 50 weekly moving average. In other words, this has been a very sharp and quick decline.
9 months later, the stock market is up 91% of the time. But I want you to look at the 2007 and 2000 cases.
- Crash in July 2007. Stock market rallied to new all time highs, then bull market ended in October 2007.
- Crash in January 2000. Stock market rallied to new all time highs, then bull market ended in March 2000.
So even in the worst case scenario, this bull market will have a new all time high.
Click here for more market studies
By Troy Bombardia
I’m Troy Bombardia, the author behind BullMarkets.co. I used to run a hedge fund, but closed it due to a major health scare. I am now enjoying life and simply investing/trading my own account. I focus on long term performance and ignore short term performance.
Copyright 2018 © Troy Bombardia - All Rights Reserved
Disclaimer: The above is a matter of opinion provided for general information purposes only and is not intended as investment advice. Information and analysis above are derived from sources and utilising methods believed to be reliable, but we cannot accept responsibility for any losses you may incur as a result of this analysis. Individuals should consult with their personal financial advisors.
© 2005-2022 http://www.MarketOracle.co.uk - The Market Oracle is a FREE Daily Financial Markets Analysis & Forecasting online publication.