


USD and US Tr. Yields Retreat, GBP Gains on Brexit-deal Report
Currencies / Forex Trading Oct 11, 2018 - 03:16 PM GMTBy: C_Pissouros

 The dollar traded lower against its major peers on Tuesday as US Treasury yields pulled back after hitting a new high. The pound was among the main gainers, surging after a report noted that the terms of the UK’s exit from the EU could be settled next week.
USD Pulls Back as US Treasury yields Come off Their Highs
The dollar traded lower against all but one of the other G10 currencies on Tuesday. It managed to gain fractionally only against SEK. The main winners against the greenback were NZD, GBP and AUD in that order, while the currency that gained the least was JPY.
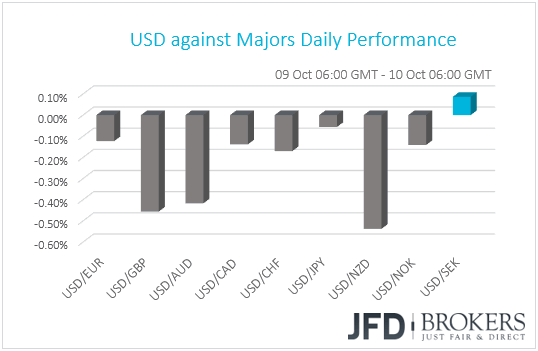
In our view, the pattern suggests a slight improvement in investors’ risk appetite. Monday's big gainer, the safe-haven yen, performed poorly against the dollar, while the commodity-linked currencies AUD and NZD, were among yesterday's main winners. As far as the equity market is concerned, most major EU indices ended their sessions in the green. That said, in the US, the S&P 500 and the Dow Jones were slightly down, and Nasdaq was flat. During the Asian trading Wednesday, Japan’s Nikkei 225 and China’s Shanghai Composite Index closed slightly up, +0.08% and +0.018% respectivelly.
Even though the fundamental catalyst is not so clear, we believe that EU indices may have been driven once again by developments surrounding Italy’s political landscape. Yesterday, in his address to Parliament, finance minister Giovanni Tria said that he did not think Italy’s deficit forecasts were shocking. Although this round of remarks failed to reassure investors, his pledge to do whatever it takes if there is a financial crisis may have calmed investors’ nerves somewhat. Indeed, Italy’s 10-year government bond yields were down 1.65% yesterday, while the FTSE MIB index managed to close 1.06% up.
Now back to the dollar, the US currency slipped after DXY hit 96.15, its highest since the 20th of August. This may have been due to the pullback in US Treasury yields. The 10-year yield slid 0.77% yesterday, after hitting a new 7-year high of 3.261. Overnight, US President Donald Trump said that he is not happy with the Fed’s policy and that they don’t have to go as fast on rates because inflation is “really checked.” Trump’s remarks may have weighed somewhat on yields, but his disagreement with the Fed is not something new.
Trump criticized the Fed’s plans a few times in recent months, with Fed officials sticking to their guns and proving their independence. The key takeaway we got from the latest Fed meeting, as well as Chair Powell’s recent remarks, is that policymakers remain willing to continue raising rates until data suggests otherwise. Thus, even if the dollar extends yesterday’s slide for a while more, strong economic releases are likely to keep expectations of future rate increases elevated and thereby, the yields and the dollar could come under buying interest again.
AUD/USD – Technical Outlook
Overall, AUD/USD continues to trade below its long-term downwards moving trendline, taken from the peak of the 16th of February. That said, the pair is trading quite far from that line, and currently, AUD/USD started showing signs of a possible correction to the upside. Also, the pair started forming higher lows on a 4-hour chart, which means that there is some buying interest showing up. For now, we will aim higher for a bit of correction, even though we remain bearish in the longer-term.
AUD/USD has now broken its key resistance area of 0.7090, which on the 11th of September acted as strong support. This has potentially opened the way towards slightly higher levels, like 0.7145 that could be the next resistance. The level is marked by the low of the 18th of September. If that level is not able to withhold the rate from moving higher, a break could lead towards the 0.7200 zone, which was the low of the 28th of September. Just about 35 pips higher lies another good potential are of resistance at 0.7235, which could stall the rate for a bit.
The RSI has shifted above 50 and points to the upside. The MACD, even though fractionally below zero, is showing a strong upmove and is also above its trigger line. It could turn positive soon. Both indicators are in support of the idea discussed above.
Alternatively, a drop back below the 0.7040 line could be seen as a good opportunity for more bears to step in and drive AUD/USD lower, towards the next potential area of support at 0.6970, which was the low of the 9th of February 2016. If the selling doesn’t stop there, a further drop could lead to a test of the 0.6920 barrier, marked by the low of the 26th of January.
![]()
GBP Rebounds on Brexit Reports
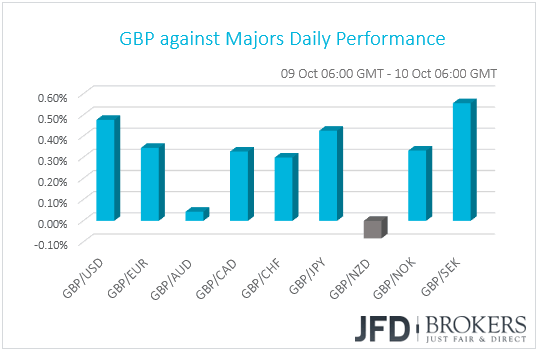
The pound managed to again almost against all the other G10 currencies yesterday. It lost some ground only against NZD, while it traded virtually unchanged against AUD. The British currency gained the most against SEK, USD and JPY in that order.
Sterling rebounded strongly yesterday, following a Wall Street Journal Report that the terms of the UK’s exit from the EU could be settled next week, and perhaps as early as Monday. The news follows remarks by EU negotiators, who said on Friday that the two sides are “very close” in finding common ground, and weekend comments by EU Commission President Jean-Claude Juncker, who noted that the chances of a deal have increased recently, adding that an accord could be reached by November.
In our view, barring any headlines suggesting otherwise, we believe that the pound could continue gaining in the days to come, due to increased optimism that a Brexit deal could be agreed soon. We believe that the no-deal fears, which dragged the pound down over the summer, have diminished. However, as we get closer to next week’s EU summit, we believe that the GBP-bulls will start getting more cautious and any further gains may not be as steep as yesterday.
We stick to our guns that next week’s summit could be the “moment of truth” as EU Chief Negotiator Michel Barnier and the President of the EU Council Donald Tusk recently noted. If indeed, EU and UK officials agree on the divorce terms, the pound could skyrocket. According to market chatter, many investors think that it is still unlikely to get everything settled this month, and thus, something like that is likely to be a positive surprise. That said, even if a deal is not struck at this summit, a notable progress could increase the likelihood for an accord to be finalized in November. This could still prove supportive for the pound, but we don’t expect an immediate surge as in the first scenario. Now, in case next week’s talks fail to bear fruit, the lack of material steps towards a deal could revive fears of a disorderly Brexit and thereby, weigh on the British currency.
GBP/CHF – Technical Outlook
GBP/CHF is still climbing higher above the short-term upside support line drawn from the low of the 21st of September. The pair continues to create higher peaks and higher lows and it looks like that the bulls are feeling quite comfortably in the driver’s seat. As long as the upside line remains intact, we will stay positive over the near-term outlook.
Yesterday, GBP/CHF moved above the important resistance of 1.3025, marked by Monday’s high. The next possible resistance area for the pair could be at 1.3105, marked by the high of the 26th of July. Slightly above sits another good potential resistance zone at 1.3140, which was the high of the 18th of July. Let’s not forget a scenario, where GBP/CHF could at some point correct back down towards the upside line and then bounce to the upside again, aiming for higher levels.
On the downside, for us to get comfortable with GBP/CHF sliding lower, we would need to see a break, not only below the aforementioned upside support line, but also below the 1.2935 hurdle, marked by the low of the 8th of October. This way more bears could get interested in order to get involved in the job of pushing GBP/CHF towards the 1.2885 level, a break of which, could set the stage for a decline to the 1.2815 obstacle, which held the rate from dropping lower on the 3rd of October.
![]()
As for Today’s Events
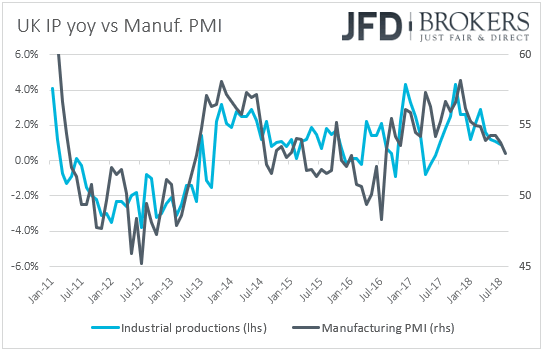
From the UK, we have industrial and manufacturing production data for August. Industrial production is anticipated to have accelerated to +0.2% mom from +0.1% in July, something that could bring the yoy rate up to +1.1% from +0.9%. Manufacturing production is expected to have rebounded 0.2% mom after falling by the same pace the previous month. This is likely to drive the manufacturing yearly rate up to +1.5% from +1.1%. Having said all these though, bearing in mind that the manufacturing PMI for the month declined to 53.0 from 53.8, we view the risks surrounding the forecasts as tilted to the downside. The nation’s trade balance for August is also coming out and expectations are for the UK trade deficit to have widened to GBP -11.8bn from -10.0bn. We get the monthly GDP data for August as well. Expectations are for a slowdown back to +0.1% mom from +0.3% mom in July, which could drive the qoq rate down to +0.5% from +0.6%.
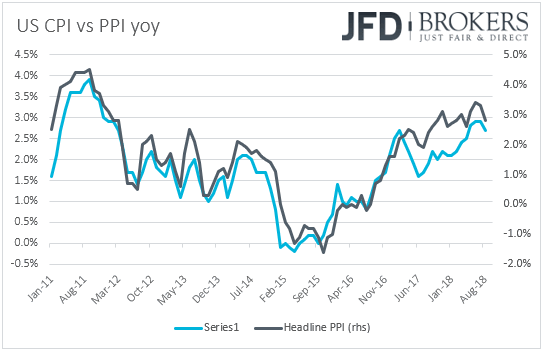
In the US, the PPIs for September are scheduled to be released. Expectations are for the headline rate to have remained unchanged at +2.8% yoy, while the core rate is anticipated to have risen to +2.5% yoy from +2.3% in August. Accelerating core producer prices could result in accelerating core consumer prices and thus, these prints may raise some speculations that the CPIs, due out tomorrow, could move in a similar fashion.
From Canada, we get building permits for August and expectations are for a 1.3% mom rebound after a 0.1% slide in July.
With regards to the energy market, the American Petroleum Institute (API) weekly crude oil inventory report is coming out, but no forecast is available.
As for the speakers, we have three on the agenda. During the European morning, BoE’s Chief Economist Andy Haldane speaks, while during the Asian morning Thursday, we will get to hear from Atlanta Fed President Raphael Bostic and RBA Assistant Governor Luci Ellis.
by Charalambos Pissouros
JFD Brokers is an internationally licensed global provider of multi-asset trading and investment services applying a pure agency model with 100% DMA/STP execution of all client orders - direct, anonymous and MiFID compliant post-trade transparent access to 20+ LPs (Tier1 Banks, Non-Bank LPs and MTFs) for a choice of 1000+ instruments.
Author Bio: Charalambos joined JFD Brokers in 2017 as a Senior Market Analyst for the JFD Research team. He has more than 4 years of experience in analyzing financial markets, with his primary focus on the currency markets. After reviewing economic and political agendas, he evaluates how market data and events can affect the financial world, which technical levels come into play, and how bigger trends relate to corresponding economic developments. His approach is a blend of both fundamental and technical analyses. Charalambos became a Certified Financial Technician (CFTe) of the International Federation of Technical Analysts, after being rated top-of-the class during his studies and excelling in the STA diploma exams with distinction. He is now a member of the Society of Technical Analysts (STA) and the CySEC public register, and is also a holder of a BSc degree in Mathematics and an MSc degree in Actuarial and Financial Mathematics from the Aegean University in Greece.
Disclaimer:
The content we produce does not constitute investment advice or investment recommendation (should not be considered as such) and does not in any way constitute an invitation to acquire any financial instrument or product. JFD Brokers, its affiliates, agents, directors, officers or employees are not liable for any damages that may be caused by individual comments or statements by JFD Brokers analysts and assumes no liability with respect to the completeness and correctness of the content presented. The investor is solely responsible for the risk of his investment decisions. Accordingly, you should seek, if you consider appropriate, relevant independent professional advice on the investment considered. The analyzes and comments presented do not include any consideration of your personal investment objectives, financial circumstances or needs. The content has not been prepared in accordance with the legal requirements for financial analyzes and must therefore be viewed by the reader as marketing information. JFD Brokers prohibits the duplication or publication without explicit approval.
CFDs are complex instruments and come with a high risk of losing money rapidly due to leverage. 75% of retail investor accounts lose money when trading CFDs with the Company. You should consider whether you understand how CFDs work and whether you can afford to take the high risk of losing your money. Please read the full Risk Disclosure.
© 2005-2022 http://www.MarketOracle.co.uk - The Market Oracle is a FREE Daily Financial Markets Analysis & Forecasting online publication.