Euro Vulnerable as Slowing Growth Reveals Underlying Issues
Currencies / Euro Oct 09, 2018 - 05:25 PM GMTBy: Submissions
Deb Shaw writes:
 Economic indicators point to a worsening slowdown in the Eurozone
- As growth slows, cracks are beginning to appear, starting with Italian financial markets
- After engineering a massive trade surplus, Eurozone now reliant on its trading partners
In our last commentary on the euro in late August, we wrote that the common currency was set to weaken further thanks to (1) slowing growth, (2) slowing inflation and (3) an outsized speculator long position in euro futures and options. Following the publication of our last commentary, EUR/USD has weakened from 1.1730 – 1.180 (the top-end of its trading range that we update daily on our website) down to 1.1510 (the current price on October 4).
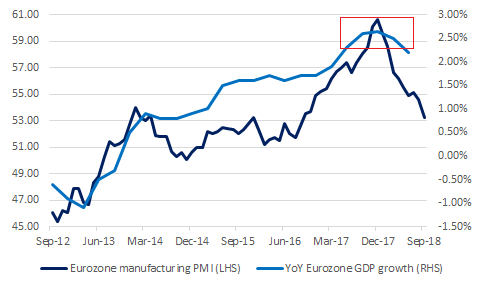
When the euro rallied last year, speculators were happy to ignore the region’s many underlying economic issues. Looking at the data, year-over-year GDP growth accelerated from 1.9% in Q1 2017 to 2.7% Q4 2017. Remarkably, the Eurozone grew at a faster clip in late 2017 relative to even the United States. Thanks to the euro’s ‘risk on’ qualities, the currency tends to strengthen in response to accelerating economic growth in the region.
Following many quarters of significant gains, few expected a slowdown. Note that we warned Eurozone growth was set to deteriorate significantly last April (just before the euro began weakening). Looking ahead, we expect the deteriorating downturn to reveal significant issues in the Eurozone. Specifically, the Eurozone is increasingly vulnerable thanks to rising debts, weak demographics and an excessive reliance on its trade surplus (particularly with the United States and the United Kingdom). As economic data from the region continues to deteriorate, expect these issues to dominate investor concerns.
Eurozone economic data continues to deteriorate
As described above, the euro is a ‘risk on’ currency that broadly tracks Eurozone growth in rate-of-change terms. After peaking in Q4 2017, year-over-year growth in the region has slowed to 2.2% in Q2 2017 (shown below). Forward-looking economic indicators that have historically foreshadowed changes in growth trends, such as manufacturing sentiment, have also weakened sharply in recent history. An overview of Eurozone GDP growth and manufacturing PMIs are shown below:
Weakening sentiment = weakening growth

Source: Eurostat, Markit, MarketsNow
As can be seen above, both manufacturing sentiment and economic growth accelerated by a significant degree following Macron’s victory in the second quarter of 2017. In response to improving data, EUR/USD rallied sharply as a result. After peaking in Q4 2017, sentiment has now deteriorated sharply.
Going forward, upcoming Eurozone GDP growth rates will have to contend with steepening base effects. Put another way, an acceleration in year-over-year growth is mathematically more challenging in Q3/Q4 2018 as growth was high at this point last year. Beyond math, the Eurozone’s export-oriented manufacturing sector is also running out of steam. Between weakening growth drivers and tough math, economic growth is likely to keep slowing.
Italian woes symptom of a larger problem
As Eurozone growth continues to slow, the region’s weaknesses are now in focus. In recent history, financial media outlets have been focused on the Italian government’s new budget. As the anti-establishment government pushes for higher government deficits, Italian financial assets have been tumbling in response. While euro traders ignored the country last year, Italian political developments are now driving the euro.
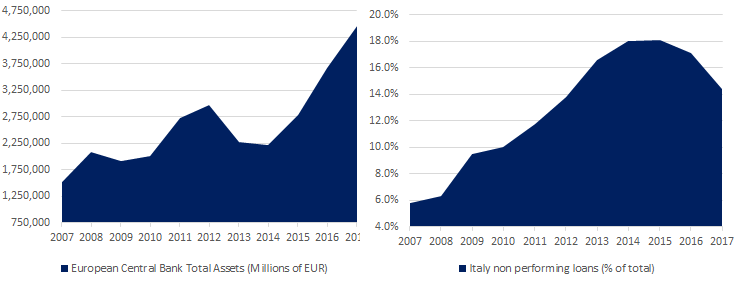
We argue that the latest developments in Italy are only a symptom of a much larger problem. While the European Central Bank’s actions following the 2011-2012 crisis saved the monetary union at the time, it achieved this outcome at a significant cost. Now that growth is slowing, this cost is becoming more apparent. An overview of Italian non-performing loans and the ECB’s balance sheet are shown below for reference:
European Central Bank’s magic trick saves Italy

Source: European Central Bank, CEIC data, MarketsNow
As can be seen above, non-performing loans in the Italian banking system began rising following the global financial crisis in 2008. At the height of the Eurozone crisis, the riskiest government bonds suffered significant weakness. In other words, the bond market was pricing in a good chance of bankruptcy and assigned many Eurozone governments ‘junk’ status.
Instead of allowing any of its members to either declare bankruptcy or exit the monetary union, the ECB instead engineered a rescue. Its plan involved buying large quantities of Eurozone bonds using its balance sheet (i.e. quantitative easing) and reducing interest rates to ease borrower pain. This is why the ECB’s balance sheet grew significantly over the past few years. Instead of allowing any single member to devalue its currency (by exiting the monetary union), the euro itself weakened against other major currencies.
Thanks to a weak euro, rising exports and stronger economic growth have helped keep non-performing loans in check. Looking at the graph above, Italian non-performing loans (as a proportion of total banking assets) peaked at 18% and have been declining since that time.
Reliance on trade surplus a significant vulnerability
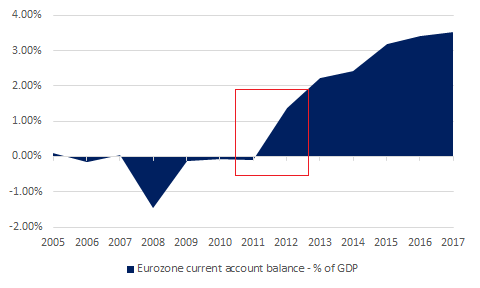
While the ECB helped alleviate the crisis, it does so at the expense of its trading partners. Prior to the crisis, the Eurozone did not have a significant current account surplus with the rest of the world. Instead, member states with significant current account surpluses (such as Germany) earned most of their surpluses via trade with other Eurozone member states. Following the crisis, member states with significant deficits were unable to maintain the previous arrangement. As a result, the Eurozone exported its way out of this issue by engineering a weaker euro. As the ECB lowered interest rates and pursued an aggressive quantitative easing program, exports from the Eurozone soared. This is shown below:
Foreigners pay the cost of Eurozone unity

Source: IMF – World Economic Outlook, MarketsNow
As can be seen above, the Eurozone’s current account balance (the sum of its trade balance and income from abroad) soared following the ECB’s actions in 2011 and 2012.
Today, the same factors that caused the Eurozone crisis are starting to play out at a global scale. In the United States, President Trump is pursuing an ‘America First’ doctrine to reduce the size of the U.S. deficit. In the United Kingdom, Brexit was a powerful backlash against the current status quo. The U.S. and the U.K. maintain the world’s largest and second-largest current account deficits, respectively.
Ultimately, countries with significant current account surpluses (such as Germany, Japan and China) remain exposed in the event of rising trade tensions. This is especially the case for the Eurozone as the region has used its current account surplus as a means of financing its significant underlying problems. Now that current account deficit countries are rebelling against the status quo, expect increasing tensions to weigh on the euro.
Speculator positioning points to a neutral outlook
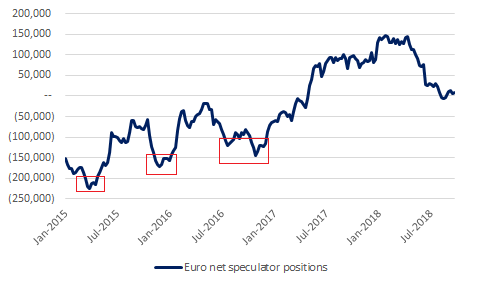
Beyond weakening growth and underlying economic issues, the euro can also fall much further based on trends in speculator positioning. Every week, the U.S. CFTC publishes the Commitments of Traders Report illustrating how speculators are positioned in futures and options exchanges. A historical overview of speculator positioning in euro futures and options is shown below:
Euro speculators remain in neutral

Source: CFTC, MarketsNow
After speculators built up the all-time largest net long position in the euro in early 2018 (almost 150,000 contracts net long), speculators have reduced their long positions significantly since that time. Looking at recent history, speculators were short the euro to the tune of more than 200,000 contracts in early 2015. As recently as late 2016, speculators were short the currency by almost 150,000 contracts. If history is any guide, speculator positions have room to fall much further. In other words, the current speculator net position is no obstacle for further euro weakness.
As growth reverses course, markets discover what’s hidden underneath
As the Warren Buffet saying goes: “Only when the tide goes out do you discover who's been swimming naked.” Now that the tide is going out, euro traders are about to discover the true extent of the Eurozone’s underlying problems. While we are not forecasting an imminent recession, the region’s weak fundamentals mean that the sell-off can worsen significantly. For now, the sell-off hitting Italian financial markets is an early warning sign of what may be coming.
For traders looking to enter euro short positions, we recommend entering the trade at the top-end of our EUR/USD trading range, updated daily on our website.
By Deb Shaw
Deb founded MarketsNow after realizing that there was an opportunity to publish high quality financial market analysis that would help people make better decisions. Prior to MarketsNow, Deb worked in a variety of roles across financial services. Specifically, he worked in foreign exchange trading in Hong Kong (GAIN Capital), in international payments – also in Hong Kong (Forex.com Money Transfers, World First) and in technology venture capital in Canada (VantagePoint Capital Partners, Tandem Expansion Fund). He is a graduate of McGill University and the University of Hong Kong.
© 2018 Copyright Deb Shaw - All Rights Reserved
Disclaimer: The above is a matter of opinion provided for general information purposes only and is not intended as investment advice. Information and analysis above are derived from sources and utilising methods believed to be reliable, but we cannot accept responsibility for any losses you may incur as a result of this analysis. Individuals should consult with their personal financial advisors.
© 2005-2022 http://www.MarketOracle.co.uk - The Market Oracle is a FREE Daily Financial Markets Analysis & Forecasting online publication.


