


Elliott Wave Analysis of the SP-500 (SPX)
Stock-Markets / Stock Markets 2018 Sep 21, 2018 - 01:42 PM GMT

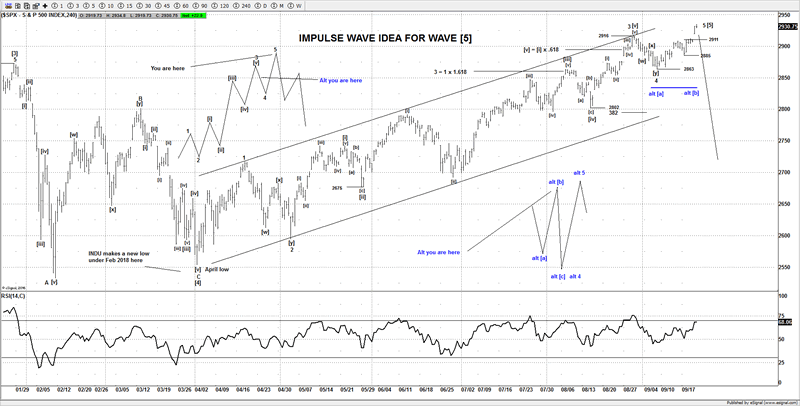
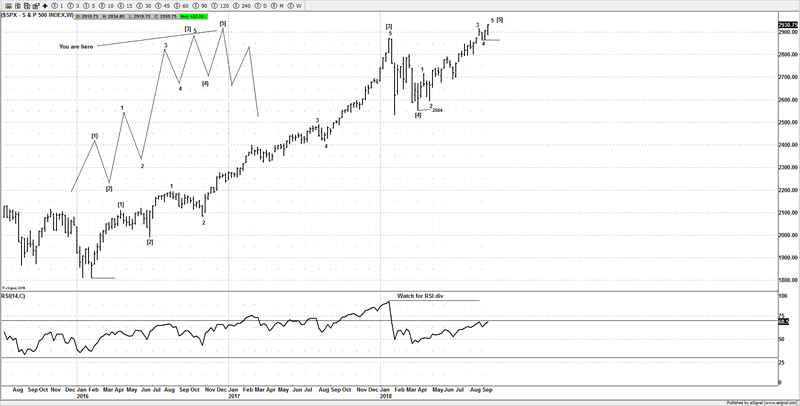
 The advance from the April lows is currently the focus for us, as I believe the orthodox low for wave [4] was made in April 2018, so we are trying to count an impulse wave (5 wave advance). With the sub-divisions from the April lows, we can now suggest there are enough gyrations in place to warrant some caution for the current bullish trend from those April lows. The Dow Jones Industrial Average also confirmed the SPX idea and made a new all-time high, so that’s now aligned all 3 markets NDX, SPX and the DJIA with the same impulse wave idea from the 2016 lows.
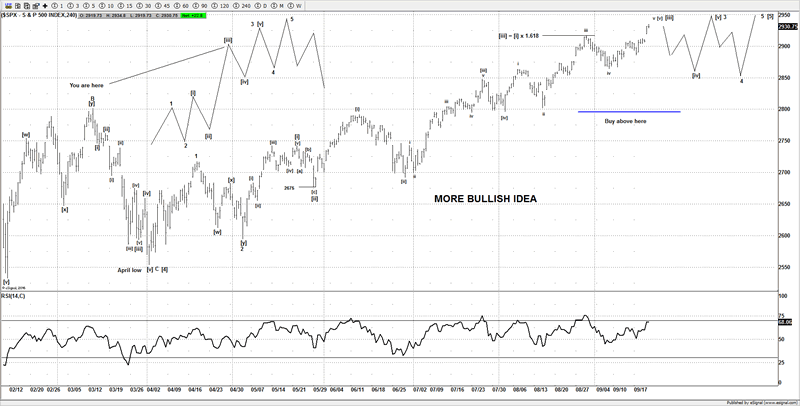
However in order to suggest a move lower we would still need to at least see a move back under 2885 to support further downside as there are a number of ways to label the move from 2863. My preferred idea is that wave 5 is now close to completion, although the more bullish case would suggest its only ending wave [iii] of wave 3. Either idea would still need a move back under 2885 to suggest more weakness. The next decline is key, as a 3 wave pullback that holds around 2850-2840 likely supports the more bullish idea. A much stronger/impulsive decline in 5 waves below 2800 would give more credence to the preferred idea.
Until we see a break under 2885, then the current trend remains up and the bulls have full control of the market at this stage. A small 5 wave decline below 2885 would be a subtle clue to potentially supporting a move lower. How the next decline develops will help decide if the market is going to continue far higher above 3050-3100.
Alt idea
Once the impulse wave from the April 2018 low is complete, that can also support the idea the advance from the 2016 lows has ended a larger impulse wave. So an impulse wave at two degrees of trend would have ended and setup for a significant move lower.
Until next time,
Have a profitable week ahead.
Click here to become a member
You can also follow us on twitter
What do we offer?
Short and long term analysis on US and European markets, various major FX pairs, commodities from Gold and silver to markets like natural gas.
Daily analysis on where I think the market is going with key support and resistance areas, we move and adjust as the market adjusts.
A chat room where members can discuss ideas with me or other members.
Members get to know who is moving the markets in the S&P pits*
*I have permission to post comments from the audio I hear from the S&P pits.
If you looking for quality analysis from someone that actually looks at multiple charts and works hard at providing members information to stay on the right side of the trends and making $$$, why not give the site a trial.
If any of the readers want to see this article in a PDF format.
Please send an e-mail to Enquires@wavepatterntraders.com
Please put in the header PDF, or make it known that you want to be added to the mailing list for any future articles.
Or if you have any questions about becoming a member, please use the email address above.
If you like what you see, or want to see more of my work, then please sign up for the 4 week trial.
This article is just a small portion of the markets I follow.
I cover many markets, from FX to US equities, right the way through to commodities.
If I have the data I am more than willing to offer requests to members.
Currently new members can sign up for a 4 week free trial to test drive the site, and see if my work can help in your trading and if it meets your requirements.
If you don't like what you see, then drop me an email within the 1st 4 weeks from when you join, and ask for a no questions refund.
You simply have nothing to lose.
By Jason Soni AKA Nouf
© 2018 Copyright Jason Soni AKA Nouf - All Rights Reserved
Disclaimer: The above is a matter of opinion provided for general information purposes only and is not intended as investment advice. Information and analysis above are derived from sources and utilising methods believed to be reliable, but we cannot accept responsibility for any losses you may incur as a result of this analysis. Individuals should consult with their personal financial advisors.
© 2005-2022 http://www.MarketOracle.co.uk - The Market Oracle is a FREE Daily Financial Markets Analysis & Forecasting online publication.