


The Most Important Chart To Explain Why Stock Market Bears Lose Money
Stock-Markets / Stock Markets 2018 Sep 07, 2018 - 08:11 AM GMTBy: Avi_Gilburt

 I have spoken about this many times in the past, but the fact is that very few understand our financial markets. While no one is perfect when it comes to being able to identify turning points in the market, I think we all know that there has been a significant increase in that lack of perfection when it comes to the US stock market over the last three years.
You see, many focus on the wrong factors when making decisions about the stock market. While events such as Brexit, Frexit, Grexit, rise in interest rates, cessation of QE, terrorist attacks, Crimea, Trump, Syrian missile attack, North Korea, record hurricane damage in Houston, Florida, and Puerto Rico, quantitative tightening, trade wars, and many more have scared investors into believing the bull market will come to an end, none of these events have even put a dent in this bull market as it has rallied 50% during this period.
At the end of the day, markets are not about events. Markets are purely about mass psychology. When the market runs out of buyers because the great majority is bullish, then we hit a major top. And when the market runs out of sellers because the great majority is bearish, then we hit a major bottom. There's not much more you really need to understand about the market than that. The more important question is how to gauge that sentiment so you can align your purchasing and selling with those major turning points.
But first you need to understand why you may have been too bearish to enjoy the profits which have been served on a silver platter during the last several years. First, you probably read too many different perspectives, believing that the more information you have then the better decision you will make. Well, how has that helped you if you have been bearish these last three years? Moreover, most people seek some form of confirmation bias, so they pay more attention to bearish articles as compared to bullishly-inclined articles.
In fact, look at what has been offered during the last three years:
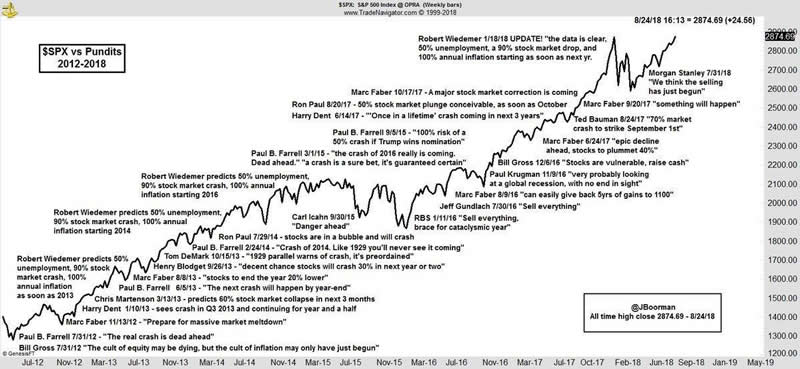
Now, to be fair, I think the creator of the chart included someone quite unfairly – Tom DeMark. Personally, I think his work is exceptional, and is not at all based upon the same factors as the others on this chart. Again, while one cannot always be right when it comes to the stock market, I think Tom is better than most, and was unfairly included in this chart. But, I digress.
Next, you have to understand how human beings process bearish perspectives relative to bullish perspectives. I have written about this several times in the past, and you can choose to refresh your recollection with this article here.
But, before you decide to ignore your bearish tendencies completely, I think you will need to hold off for the time being. Rather, I think you will likely need to get in touch with those bearish tendencies in the coming months. You see, when you look at our long-term perspective on this market, I think we are finally approaching a 20%-30% correction around the corner. While my ideal target for the S&P 500 has been the 3225SPX region for years, I also have noted that we may see an ending diagonal complete later this year in the 3011 region, which would bring about that 20%-30% correction sooner rather than later.
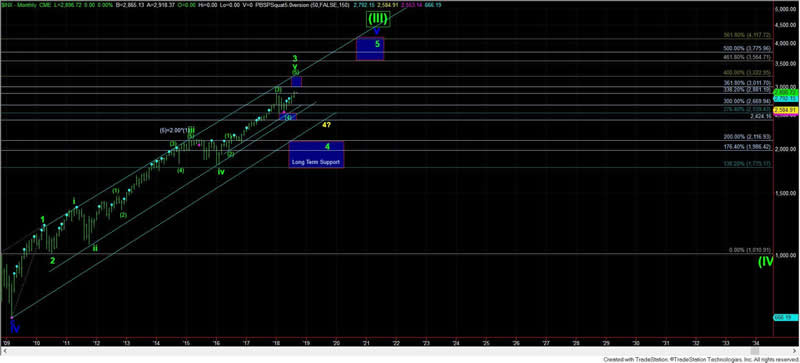
Moreover, if you think you “feel” bearish now, can you imagine what you and other investors will feel like when the market is back down to the 2400-2500SPX region? How about if we get down to the 2000-2100SPX region? Do you really think you will be able to fight those bearish tendencies, especially when it will feel like the financial market is crashing all over again?
Well, I'm giving you advance notice that this is likely what you will be dealing with when I begin to turn majorly bullish again around 2020, as I will likely expect that the stock market can even double from the point we complete the upcoming 20%-30% correction. So, you will have time to work on your ability to fight your natural tendencies in order to align yourself with the money-making side of the market. But I suggest you begin to develop the tools necessary to manage your emotions so you can align your portfolio with the opportunities I see coming a few years down the road.
Avi Gilburt is a widely followed Elliott Wave technical analyst and author of ElliottWaveTrader.net (www.elliottwavetrader.net), a live Trading Room featuring his intraday market analysis (including emini S&P 500, metals, oil, USD & VXX), interactive member-analyst forum, and detailed library of Elliott Wave education.
© 2018 Copyright Avi Gilburt - All Rights Reserved Disclaimer: The above is a matter of opinion provided for general information purposes only and is not intended as investment advice. Information and analysis above are derived from sources and utilising methods believed to be reliable, but we cannot accept responsibility for any losses you may incur as a result of this analysis. Individuals should consult with their personal financial advisors.
© 2005-2022 http://www.MarketOracle.co.uk - The Market Oracle is a FREE Daily Financial Markets Analysis & Forecasting online publication.