


Dow Secondary Stock Market High Imminent
Stock-Markets / Stock Markets 2018 Sep 03, 2018 - 01:44 PM GMTBy: Austin_Galt

Previous analysis updated – price as traded as outlined, rising to levels where a secondary is likely to form. However, there is a change to the longer term outlook in that I now favour a more substantial correction to take place before the overall bull market resumes.
Daily Chart
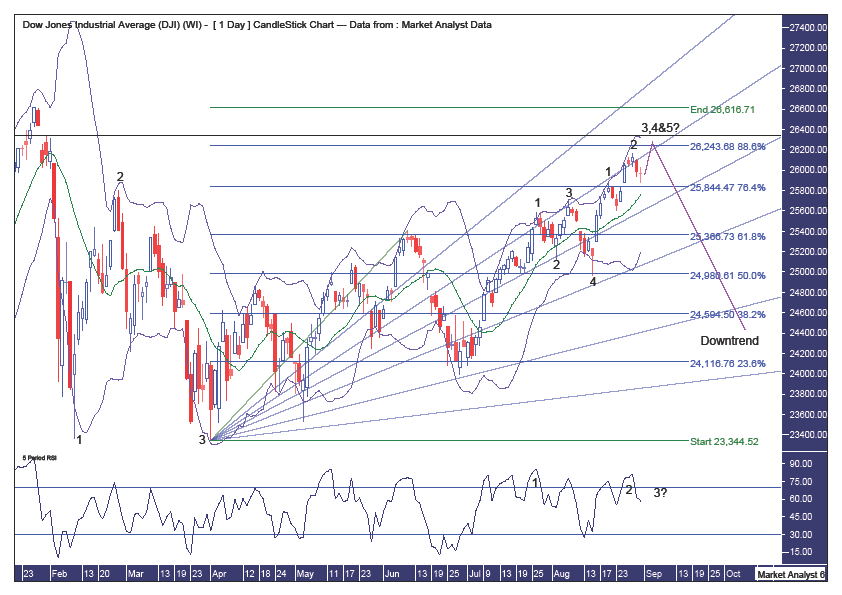
Pattern – this move into a high is setting up both a 5 point broadening low and top formation. The broadening low formation is really just a continuation pattern with the expected secondary high a point 4 high. This pattern is not seen on the continuous contract as the point 1 low was actually below the point 3 low. But we’re working with the cash chart and the point 3 low set in April was marginally below the point 1 low. Looking closer in, we can see this last phase of the move into the secondary high is setting up a 5 point broadening top with just the point 5 high remaining. Interestingly, those who follow the intraday chart will notice a 5 point broadening top is already in place however I believe this will morph into an even more bearish 7 point broadening top. Also, one more high will set up a “three strikes and you’re out” top formation. So, assuming price still has one final high to go, this expected secondary top is likely to be a point 4, 5 and 7 high as well as a third strike high all at the same time.
Bollinger Bands – price has left the upper band and I am looking for one final fling to the upside that tops out around resistance from this upper band.
Fibonacci – this past week I was thinking price might pull up just shy of the 88.6% retracement level at 26243. Given how things are looking currently I favour price to marginally clip this level. Let’s see. The 38.2% angle looks to be providing solid resistance and perhaps one last crack at this angle will see in the high and send price back down.
Horizontal line – denotes the level where price rallied back to after gapping down from the high. This level stands at 26338 and I doubt price will overcome this level. So this potentially gives us a very tight range between 26243 and 26338 to nail the high. How about 26280??
RSI – one final price high looks likely to set up a triple bearish divergence which would look nice.
Weekly Chart
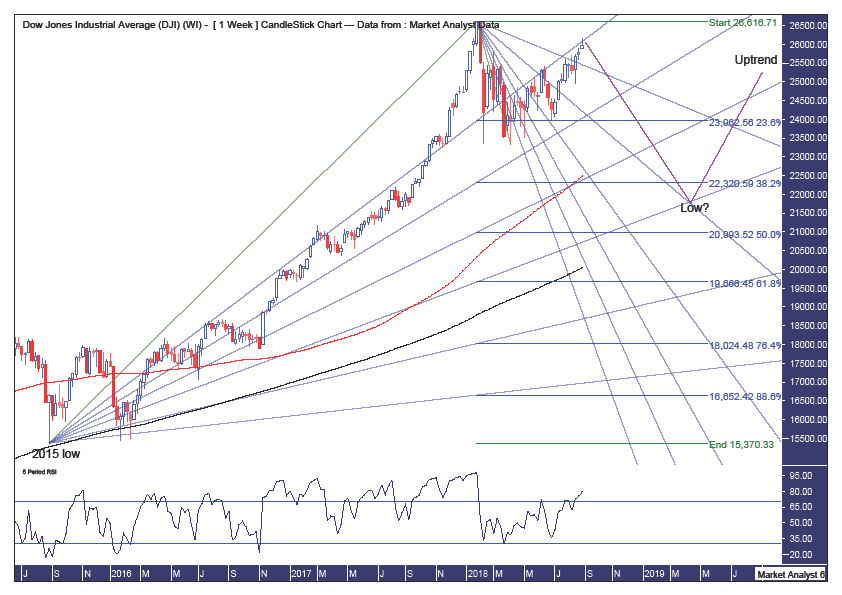
Pattern – previously I was looking for a big consolidation to take place with price to move down towards the April low before turning back up. While this is still possible, it is not my favoured scenario. Instead, I am looking for a more substantial correction to occur before the overall massive bull market resumes. And the bigger the correction now, the more energy will there be for price to launch higher later.
Fibonacci – I am targeting price to correct to around support from the 61.8% angle from the bullish fan and the 76.4% angle from the bearish fan while also clipping the 38.2% retracement level at 22320. This looks set to occur in the second quarter of 2019. Should price have lower to go then where the 76.4% angle from the bearish fan intersects with the 76.4% angle from the bullish fan around the 61.8% retracement level at 19566 is another potential target for low.
Moving averages – clearly in a bullish position and a correction now will provide some reversion to the mean and bring the averages back closer together. The 200 weekly moving average (black) is rising and looms as a good target for support to come in.
RSI – overbought.
Summing up – I am looking for one final marginal high to bring in the secondary high before a substantial decline commences.
By Austin Galt
Austin Galt has previously worked as a stockbroker and investment banker while studying technical analysis for over two decades. He is also the author of the book White Night: A Colombian Odyssey
Email - info@thevoodooanalyst.com
© 2018 Copyright The Voodoo Analyst - All Rights Reserved
Disclaimer: The above is a matter of opinion provided for general information purposes only and is not intended as investment advice. Information and analysis above are derived from sources and utilising methods believed to be reliable, but we cannot accept responsibility for any losses you may incur as a result of this analysis. Individuals should consult with their personal financial advisors.
Austin Galt Archive |
© 2005-2022 http://www.MarketOracle.co.uk - The Market Oracle is a FREE Daily Financial Markets Analysis & Forecasting online publication.