


Things You Should Know About the Last Year of this Stocks Bull Market
Stock-Markets / Stock Markets 2018 Aug 24, 2018 - 10:20 AM GMTBy: Troy_Bombardia

 Now that the S&P 500 has made a new all-time high, we can put the January-February 2018 “small correction” behind us and focus on what lies ahead.
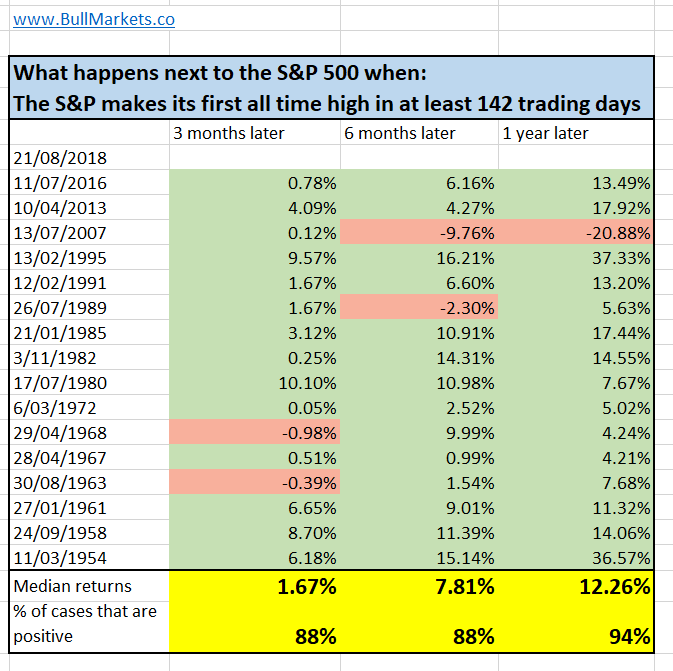
For starters, the S&P 500’s forward returns are pretty bullish (see study).
Now let’s get into the details. My recent tweet sums up my market outlook going into 2019.
Based on where the Medium-Long Term Model is today, the bull market’s top is going to be somewhere in mid-2019. This is a MOVING target. The target date will move as new data comes in. But the key point is that we should have smooth sailing for the next 6-9 months.
Why this is shaping up to be more like 2000 than 1929
Gray Cardiff has a very interesting stock market valuation indicator. This valuation indicator is the ratio of the S&P 500 to the median home price in the U.S.
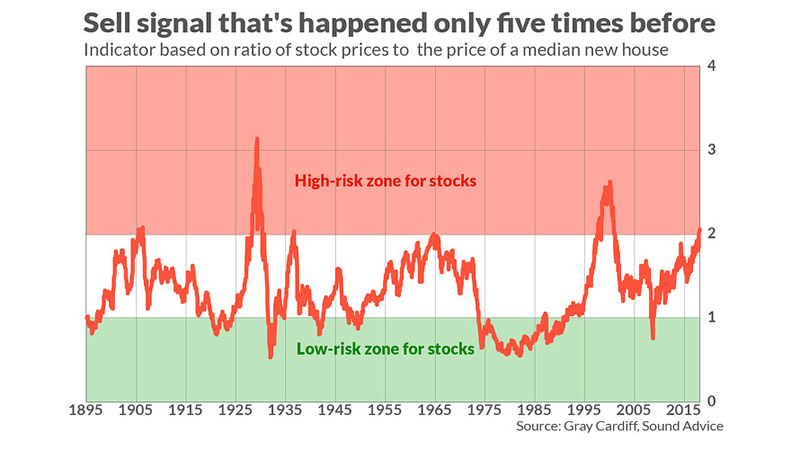
As you can see, the stock market is getting close to the “high risk zone”. However, it is important to note that this indicator is not a medium term market timing tool. In previous cases in which this indicator reached 2.0, the stock market trended higher for months and sometimes years.
I find it particularly interesting that for the 2 historical cases in which this indicator exceeded 2.0 (1929 and 1998), the stock market made a blow off top. It SOARED in the final 1-1.5 years of its bull market.
Can the same thing happen again? I certainly think so. The S&P 500 rallies 10%+ per year in the final year of its bull market (i.e. leading up to 1968 top, 1973 top, 2000 top, 2007 top).
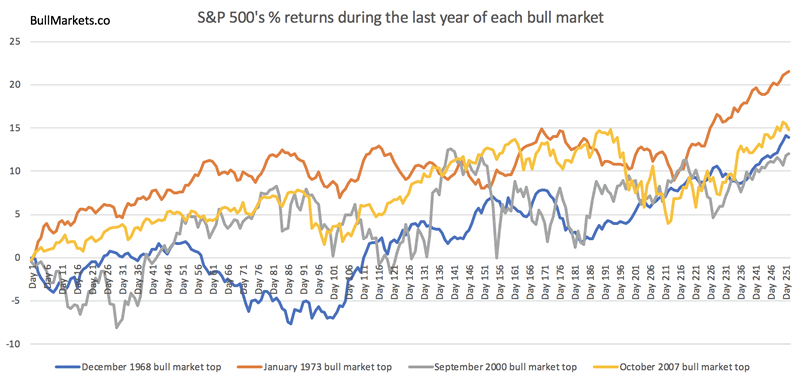
- The S&P increased 13.8% leading up to the December 1968 top.
- The S&P increased 21.5% leading up to the January 1973 top.
- The S&P increased 12% leading up to the September 2000 top.
- The S&P increased 14.8% leading up to the October 2007 top.
In the markets, the least expected thing sometimes does occur. It would not surprise me if valuations reach or exceed the dot-com bubble before this bull market peaks.
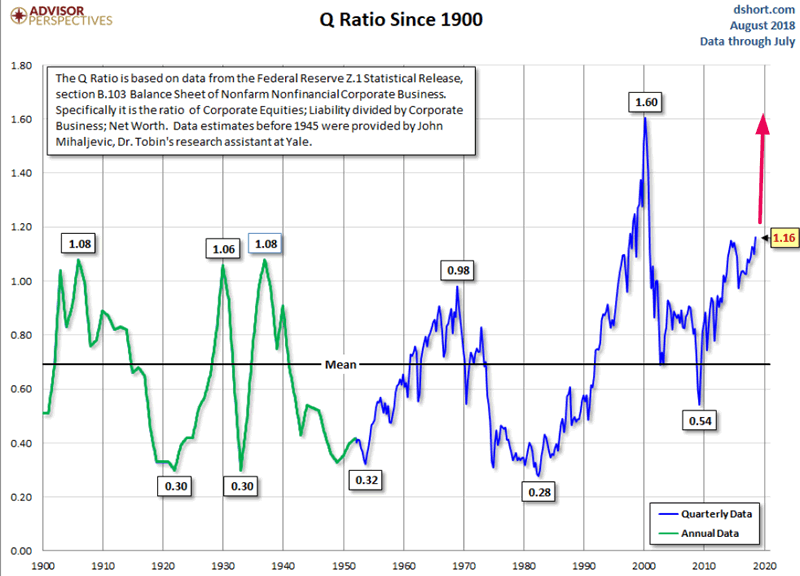
Imagine that. After the worst financial crisis in 80 years (GFC), who would have thought we’d get the biggest bubble in the past 100 years? But that’s the way the world works. Sometimes the least expected things happen.
When this bull market is over, I think we’re going to see a 2000-2002 style bear market instead of a 1929-style crash. My writeup explains the historical environment behind 1929, and why such a crash is unlikely to happen again.
The stock market is more volatile
With that being said, the final 1-1.5 years of this bull market will probably be very choppy. We will not have a repeat of 2017, when the market went up nonstop. That means momentum will not return to January 2018’s high, although price will make new highs.
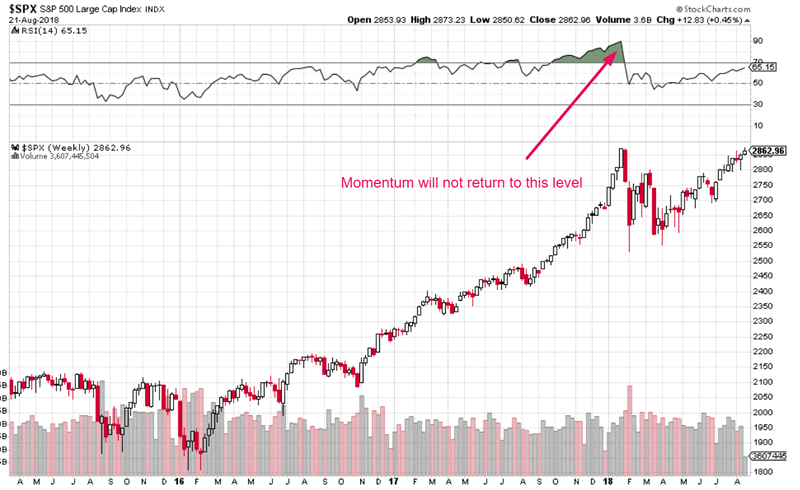
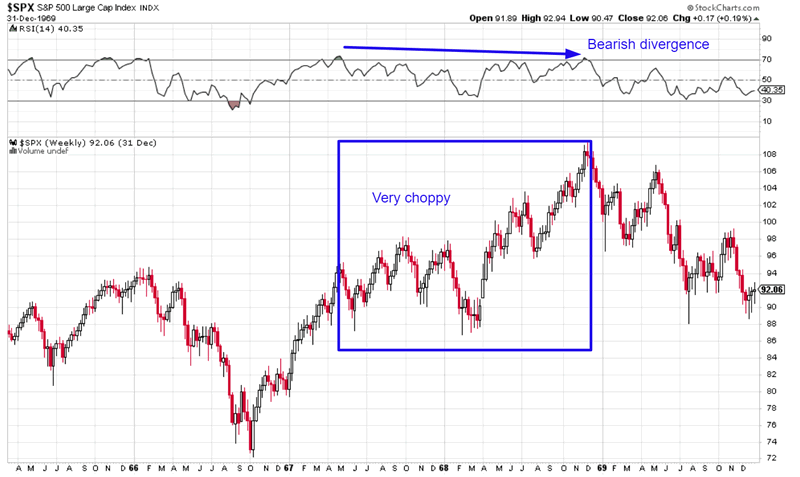
Historically, the final year before a bull market ends (bear market begins) is always very choppy.
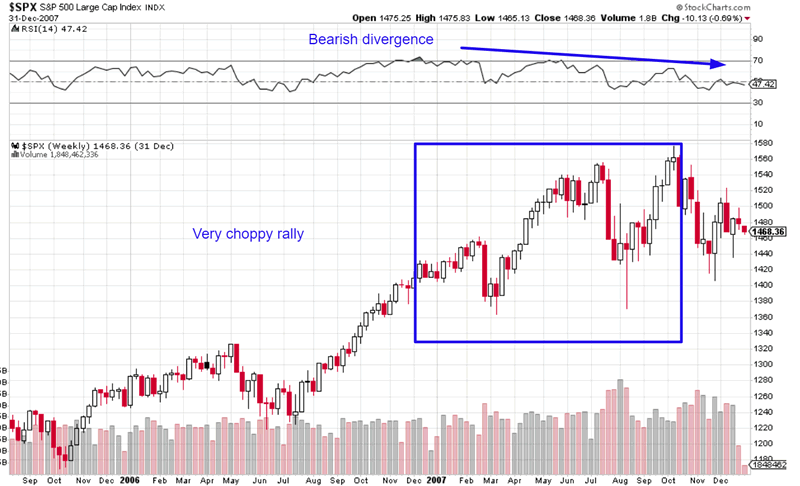
This the S&P 500 and its weekly RSI in 2007. Notice how volatile the S&P was. Notice the weekly bearish divergence.
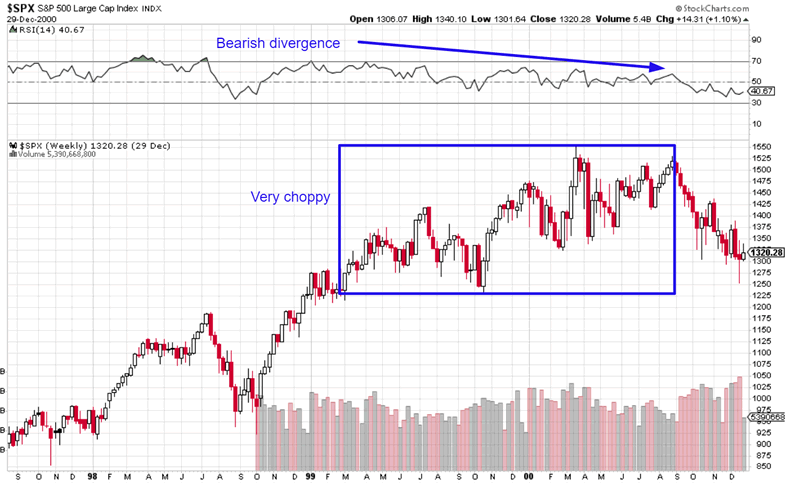
This the S&P 500 and its weekly RSI in 1999 and 2000. Notice how volatile the S&P was. Notice the weekly bearish divergence.
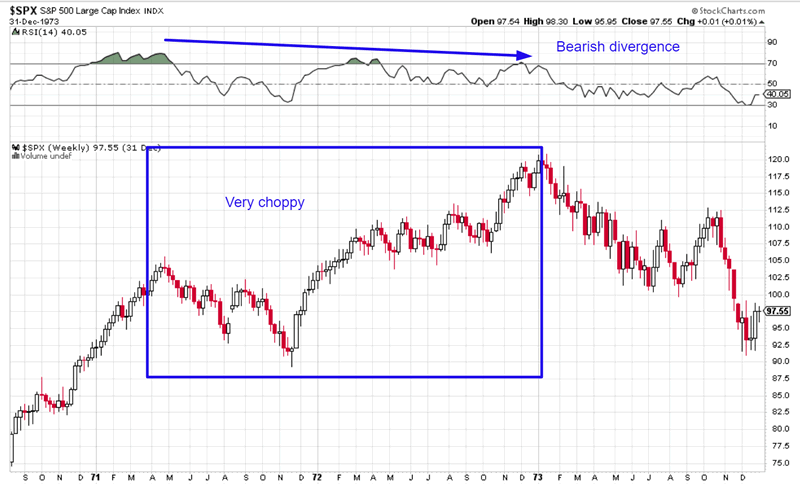
This the S&P 500 and its weekly RSI in 1972. Notice how volatile the S&P was. Notice the weekly bearish divergence.
This the S&P 500 and its weekly RSI in 1968. Notice how volatile the S&P was. Notice the weekly bearish divergence.
There are 2 things to be said about this increase in volatility.
For starters, VIX (the volatility index) tends to go up with the stock market.
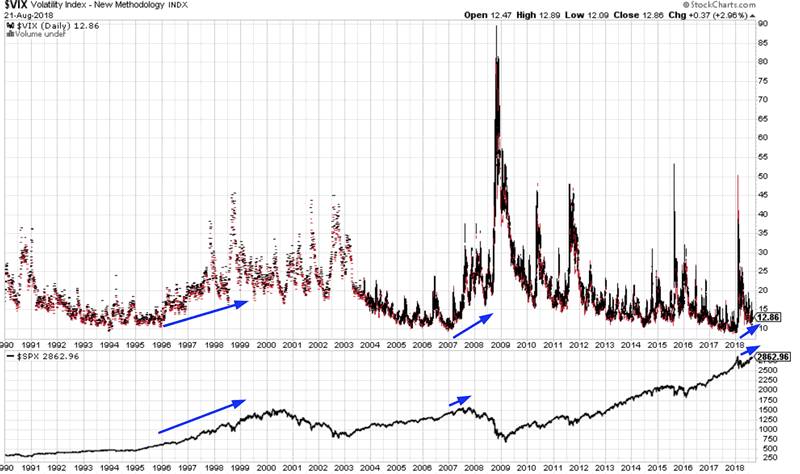
This means that going long VIX from time to time is not a bad idea.
But here’s the 2nd and more important point. In a year when the stock market rallies incessantly (e.g. 2017), the best thing to do is buy and hold. If you go long and short (as most traders do), your short positions will probably get annihilated.
But in a year like 2018 in which the stock market is very choppy, going long AND short is a profitable trading strategy. A market that’s choppy is conducive to making money on both the long side and short side.
- You buy.
- The stock market goes up. You sell at a profit.
- Your short.
- The stock market goes down. You close your short at a profit.
- Rinse and repeat.
Remember: different market environments are more supportive of different trading strategies.
What I’m worried about
Besides the Medium-Long Term Model, I’m primarily looking for signs of a sustained deterioration in the economy. The economy moves in the same direction as the stock market in the medium-long term.
The economy’s primary problem right now is that it is too perfect. Although there is still some room left in the economic expansion, there isn’t a lot of room left. This means that although the bull market has room to run, there isn’t a lot of room left.
Initial Claims is Exhibit A for this problem. Look how low Initial Claims are right now.
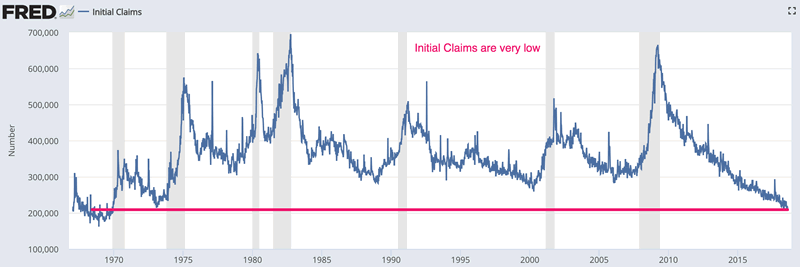
Initial Claims tends to trend higher before bull markets top (see trading model). I’m watching out for a consistent rise in Initial Claims. Initial Claims are very low right now, which means that it can start to trend higher at any time.
Conclusion
So there you have it. Be bullish, but be alert for a change in the market’s winds.
Click here for more market studies.
By Troy Bombardia
I’m Troy Bombardia, the author behind BullMarkets.co. I used to run a hedge fund, but closed it due to a major health scare. I am now enjoying life and simply investing/trading my own account. I focus on long term performance and ignore short term performance.
Copyright 2018 © Troy Bombardia - All Rights Reserved
Disclaimer: The above is a matter of opinion provided for general information purposes only and is not intended as investment advice. Information and analysis above are derived from sources and utilising methods believed to be reliable, but we cannot accept responsibility for any losses you may incur as a result of this analysis. Individuals should consult with their personal financial advisors.
© 2005-2022 http://www.MarketOracle.co.uk - The Market Oracle is a FREE Daily Financial Markets Analysis & Forecasting online publication.