Nasdaq Q's Signaling Technical Bottom
Stock-Markets / US Stock Markets Sep 16, 2008 - 01:35 PM GMTBy: Mike_Paulenoff
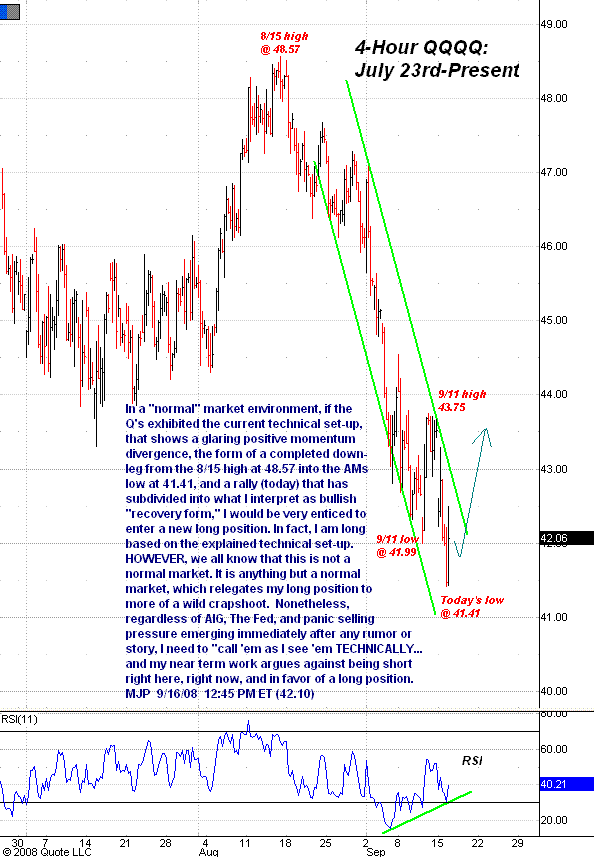
 In a "normal" market environment, if the Q's exhibited the current technical set-up that shows a glaring positive momentum divergence, the form of a completed downleg from the 8/15 high at 48.57 into the AM's low at 41.41, and a rally (today) that has subdivided into what I interpret as a bullish "recovery form," I would be very enticed to enter a new long position. In fact, our model portfolio is long based on the explained technical set-up. HOWEVER, we all know that this is not a normal market.
It is anything but a normal market, which relegates our long position to more of a wild crapshoot. Nonetheless, regardless of AIG, the Fed, and panic selling pressure emerging immediately after any rumor or story, I need to "call 'em as I see 'em" TECHNICALLY…and my near-term work argues against beng short right here, right now, and in favor of a long position.

Sign up for a free 15-day trial to Mike's ETF Trading Diary today.
By Mike Paulenoff
Mike Paulenoff is author of the MPTrader.com (www.mptrader.com) , a real-time diary of Mike Paulenoff's trading ideas and technical chart analysis of Exchange Traded Funds (ETFs) that track equity indices, metals, energy commodities, currencies, Treasuries, and other markets. It is for traders with a 3-30 day time horizon, who use the service for guidance on both specific trades as well as general market direction
© 2002-2008 MPTrader.com, an AdviceTrade publication. All rights reserved. Any publication, distribution, retransmission or reproduction of information or data contained on this Web site without written consent from MPTrader is prohibited. See our disclaimer.
Mike Paulenoff Archive |
© 2005-2022 http://www.MarketOracle.co.uk - The Market Oracle is a FREE Daily Financial Markets Analysis & Forecasting online publication.


