Why Oil Prices Fell -- Stockpiles or Price Pattern?
Commodities / Crude Oil Aug 18, 2018 - 09:04 AM GMTBy: EWI
You be the judge...
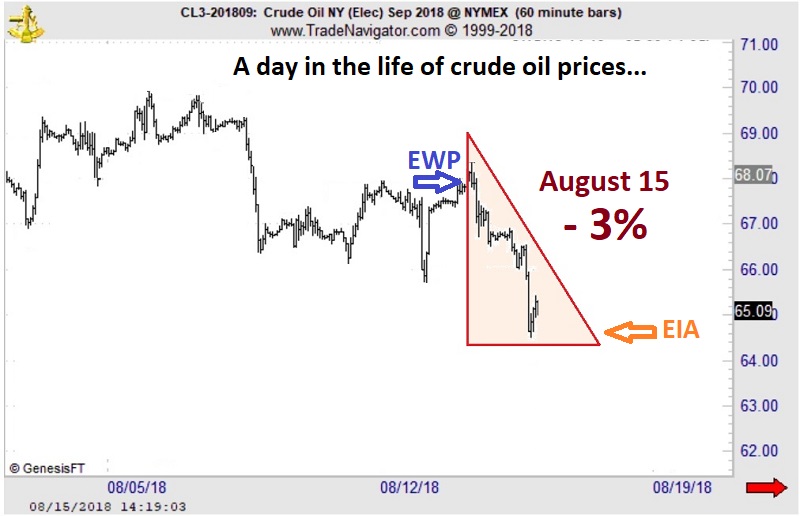
Let's cut right to the chart below. The shaded triangle highlights the dramatic price action in crude oil prices on August 15, when crude plummeted 3% to its lowest level in over nine weeks.

Now, according to the mainstream experts, the number one catalyst for crude's collapse was a shockingly bearish same-day Energy Information Administration (EIA) weekly inventory report, marked with the orange arrow in the bottom right of the chart.
What made the report so bearish was the fact that analysts forecast a 2.5 million decrease in oil stockpiles in the week ending August 10, while the EIA data showed a 6.8 million-barrel increase! Wrote one August 15 news source: "Crude Oil Prices Slammed by Surprise U.S. Inventories Build." (Seeking Alpha)
It's a perfect fit -- in the popular, news-moves-markets model, that is. The market was expecting one thing and got the complete opposite. Cue brutal selloff.
The problem with that model, however, is that it does investors and traders no favors. At best, it offers convenient explanations for price moves -- after they've already occurred.
Let's go back to the chart and consider the other arrow, the blue one labeled EWP, for the Elliott Wave Principle.
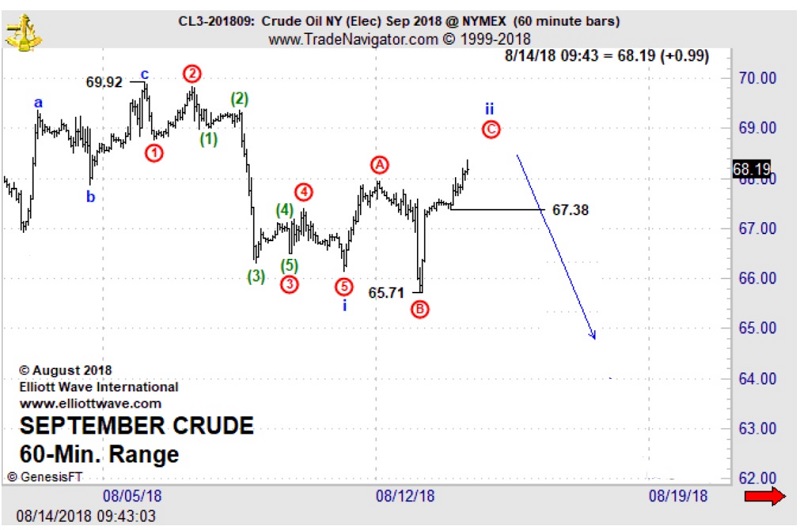
On August 14 -- one day before the bearish EIA report was released -- our Energy Pro Service identified a bearish Elliott wave setup on crude oil's price chart. There, Energy Pro Service editor Steve Craig outlined the most probable course for crude oil in the days ahead:
"Crude should be in the final leg of a countertrend advance, be it wave ii, or the larger-degree wave ((ii)). Resistance above the 68.37 intraday high is around 68.48 and then 69.11. On the downside, trade below 67.38 would offer an aggressive hint that a downward reversal is underway... the key point is that the larger trend is down."

What happened next?
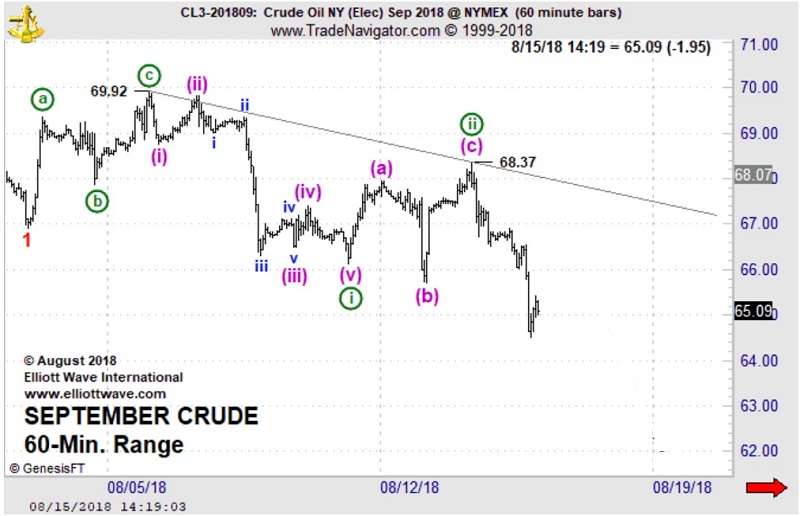
The chart below sums it up best: Crude oil finished its wave ii and hit the skids in the 3% selloff on August 15.

Elliott wave analysis posits that the main driver of market trends is investor psychology, which unfolds as Elliott wave patterns directly on price charts.
These patterns are measurable and predictable, so they enable Elliotticians to anticipate future price moves -- before they arise.
If you are prepared to take the next step in educating yourself about the basics of the Wave Principle -- access the FREE Online Tutorial from Elliott Wave International.
The Elliott Wave Basic Tutorial is a 10-lesson comprehensive online course with the same content you'd receive in a formal training class -- but you can learn at your own pace and review the material as many times as you like!
Get 10 FREE Lessons on The Elliott Wave Principle that Will Change the Way You Invest Forever.
This article was syndicated by Elliott Wave International and was originally published under the headline Why Oil Prices Fell -- Stockpiles or Price Pattern?. EWI is the world's largest market forecasting firm. Its staff of full-time analysts led by Chartered Market Technician Robert Prechter provides 24-hour-a-day market analysis to institutional and private investors around the world.
© 2005-2022 http://www.MarketOracle.co.uk - The Market Oracle is a FREE Daily Financial Markets Analysis & Forecasting online publication.


