


Moving Averages Help You Define Market Trend – Here’s How
InvestorEducation / Technical Analysis Aug 14, 2018 - 02:02 AM GMTBy: EWI

This simple moving average "works equally well in commodities, currencies, and stocksquot;
The "moving average" is a technical indicator of market strength which has stood the test of time.
Over 30 years ago, Robert Prechter described this indicator in his essay, "What a Trader Really Needs to be Successful." What he said then remains true today:
...a simple 10-day moving average of the daily advance-decline net, probably the first indicator a stock market technician learns, can be used as a trading tool, if objectively defined rules are created for its use.
So, what is a moving average?
Learn How You Can Find High-Confidence Trading Opportunities Using Moving Averages
Moving averages are one of the most widely-used methods of technical analysis because they are simple to use, and they work. Learn how to apply them to your trading and investing with this free 10-page eBook from Trader's Classroom editor Jeffrey Kennedy.
Begin to improve your trading and investing with Moving Averages today! Download Your Free eBook Now.
Elliott Wave International's Jeffrey Kennedy, a 25-year veteran of technical analysis, provides an answer:
A moving average is simply the average value of data over a specified time period, and it is used to figure out whether the price of a stock or commodity is trending up or down.
One way to think of a moving average is that it's an automated trend line.
Kennedy offers an array of examples and insights about moving averages in the instructive guide, "How to Find High-Confidence Trading Opportunities Using Moving Averages." Below, you see some of Kennedy's charts.
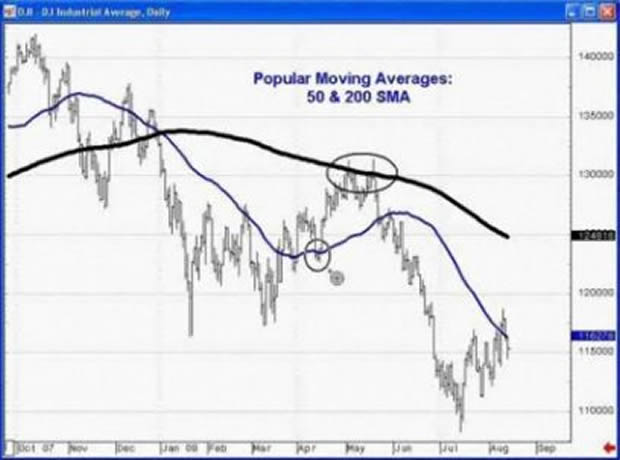
Let's begin with the most commonly-used moving averages among market technicians: the 50- and 200-day simple moving averages. These two trend lines often serve as areas of resistance or support, levels the market needs to "respect" in order for the trend to continue.
For example, the circled areas in the chart below show you where the 200-period SMA provided resistance in the DJIA's rally back in April-May (top circle), and the 50-period SMA provided support (lower circle):
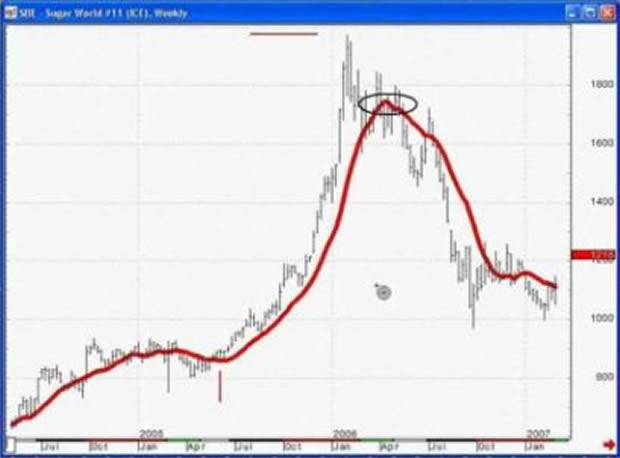
Let's look at another widely used simple moving average which "works equally well in commodities, currencies, and stocks," according to Kennedy: the 13-period SMA.
In the sugar chart below, prices first crossed above the red SMA line, which led to a substantial rally. The circled area shows you the first time the price crossed below the SMA, which came to indicate a change in trend from bullish to bearish:
Kennedy's "How to Find High-Confidence Trading Opportunities Using Moving Averages" also informs you about a useful tool to help you avoid "whipsaws."
Indeed, the first two chapters reveal:
- The Dual Moving Average Cross-Over System
- Moving Average Price Channel System
- Combining the Crossover and Price Channel Techniques
Jeffrey Kennedy's insights are all about making you a better trader.
Learn How You Can Find High-Confidence Trading Opportunities Using Moving Averages
Moving averages are one of the most widely-used methods of technical analysis because they are simple to use, and they work. Learn how to apply them to your trading and investing with this free 10-page eBook from Trader's Classroom editor Jeffrey Kennedy.
Begin to improve your trading and investing with Moving Averages today! Download Your Free eBook Now.
This article was syndicated by Elliott Wave International and was originally published under the headline Moving Averages Help You Define Trend – Here’s How. EWI is the world's largest market forecasting firm. Its staff of full-time analysts led by Chartered Market Technician Robert Prechter provides 24-hour-a-day market analysis to institutional and private investors around the world.
© 2005-2022 http://www.MarketOracle.co.uk - The Market Oracle is a FREE Daily Financial Markets Analysis & Forecasting online publication.