Moneytization as the US heads towards Recession - Gold bull market to benefit
Commodities / Gold & Silver Mar 28, 2007 - 10:17 AM GMTBy: Ned_W_Schmidt
Moneyization: The global financial phenomenon of individuals and businesses moving their funds to monies in which they have the highest confidence, or money in which they have a higher store of faith.
Or, The Vote of the Markets
To the joy of day traders, the Federal Reserve Open Market Committee, the rate setting arm of U.S. Federal Reserve, announced again their lack of commitment to sound money. For a day U.S. equity markets were filled with joy and short covering. FOMC statement, released after their meeting, suggested diligence on inflation(wink, wink), and suggested some concern for weakening U.S. economy. Easier U.S. monetary policy may require just one more indication of the collapsing U.S. housing industry and could be only one committee vote away.
U.S. monetary policy continues to be set as if the U.S. lives in economic isolation from rest of the world. Investors, consumers, governments outside the U.S. simply remain outside the analysis of the U.S. economic situation. Despite the downplay by many cable news gurus, the U.S. mortgage & housing bubble is pushing the U.S. economy into recession. Canadian recession will follow shortly thereafter. The second major asset bubble bust in seven years is now about to crush the U.S. economy. This focus on solely domestic concerns means the Federal Reserve might attempt to lower interest rates. Such an action would ignore the response of the forex market and foreign investors. U.S. dollar would slump immediately to a new low, and likely ignite the Gold market.
First Chart
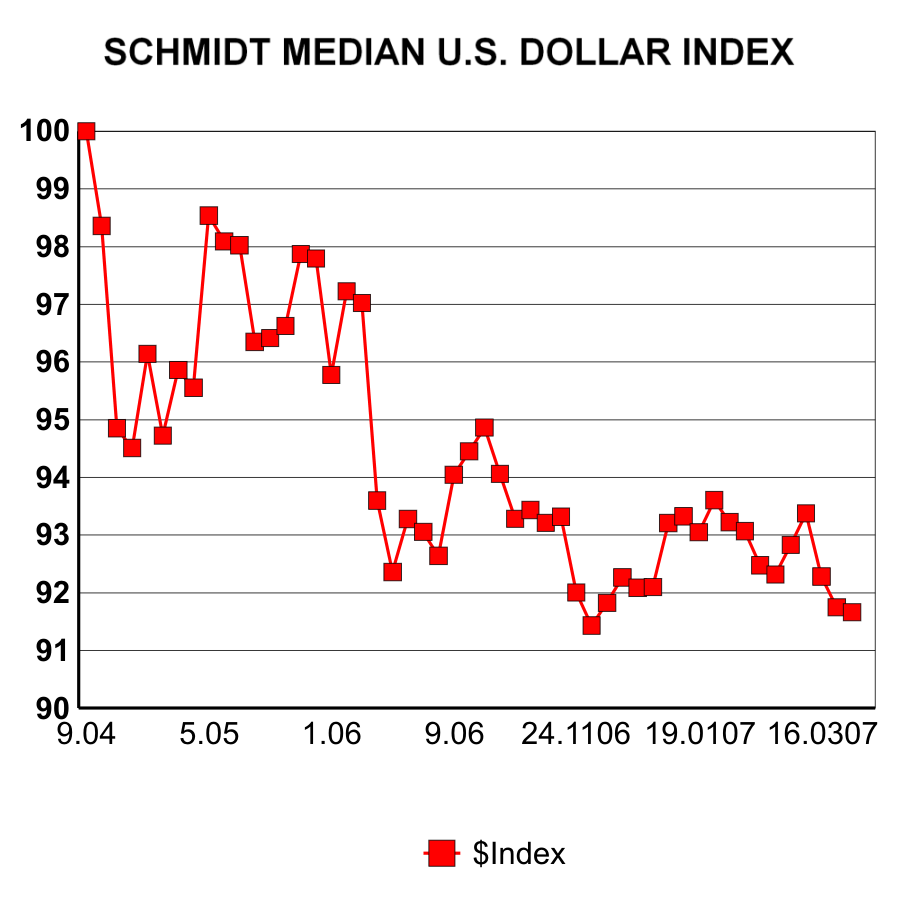
While the Federal Reserve was winking and Street analysts were rationalizing, the forex markets were voting on the U.S. dollar. That first chart is of a proprietary measure of the U.S.$'s value based on the median value change versus eleven major national monies. Due to the method of construction, it is a better measure of central tendency of the trend than the popular dollar indices. As is readily apparent from the first chart, the U.S.$ is approaching a new cycle low versus the important monies of the world. Such a development would likely set the stage for the entire Gold/Silver/Gold stock complex to move upward in a new leg in the bull market.
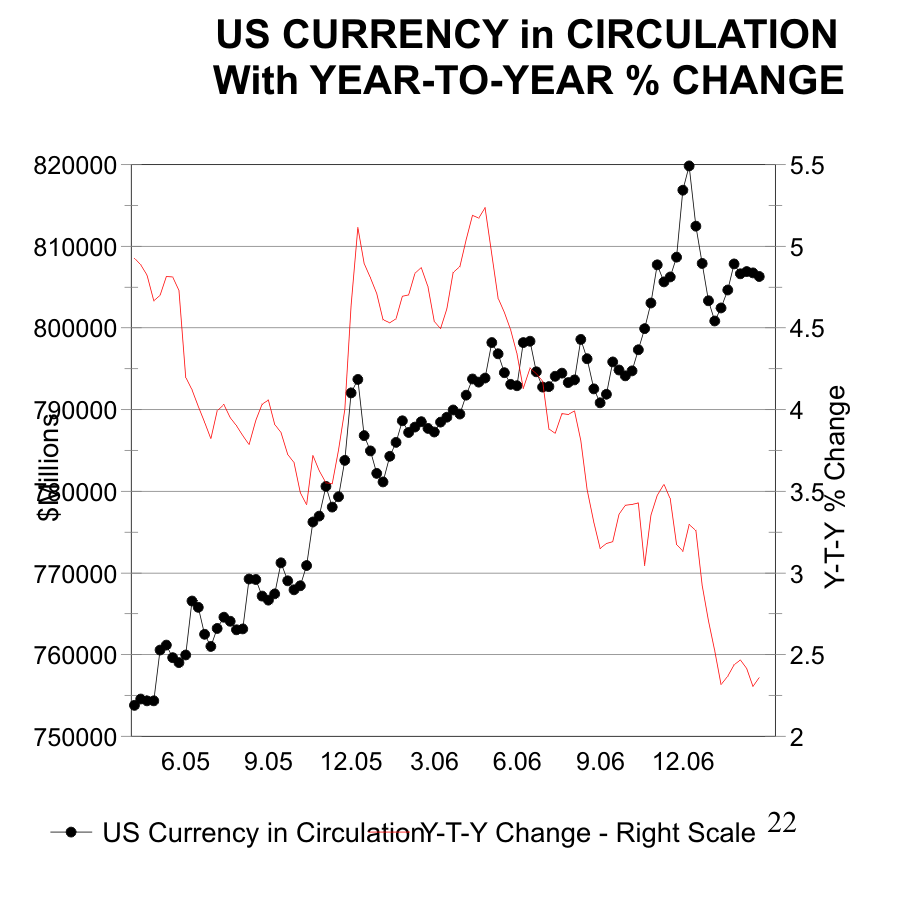
Individuals around the world are shunning the U.S. dollar. The second chart is of the amount of U.S. currency, green paper, in circulation around the world, plotted with black circles and using the left axis. More important line is the red one which is the year-to-year percent change in the amount of U.S. currency outstanding, using the right axis, and can be thought of as a momentum measure. That percentage change has been moving irregularly downward and recently was up only a little more than 2% from a year ago.
Second Chart
In short, that meager year-to-year change means the world is holding fewer dollars relative to the size of the global economy. In real terms, after adjusting for purchasing power, the value of U.S. currency in the world is shrinking. The average person on the street around the world simply has less interest, desire, willingness, need to hold U.S. dollars. Other national monies better serve them, and they are moving their wealth to those national monies. The values of Euros in circulation exceeds that of U.S. dollars, indicating the shifting money preferences of the world. U.S. dollar is playing a smaller role in the world each day and it will continue to do so . With declining ownership, the value of the dollar will continue to fall .
An imploding mortgage & housing bubble pushing the U.S. economy into a recession along with declining preference for holding U.S. currency should send U.S. dollar much lower. However, the U.S. dollar apparently has some important friends around the world. Many central banks may be worried about impact on their own economies of the U.S. dollar's value declining as the U.S. economy enters a recession. Some of their citizens might not sell as many goods to U.S. consumers. As shown in next graph, central banks have been gorging themselves on U.S. government debt.
Third Chart
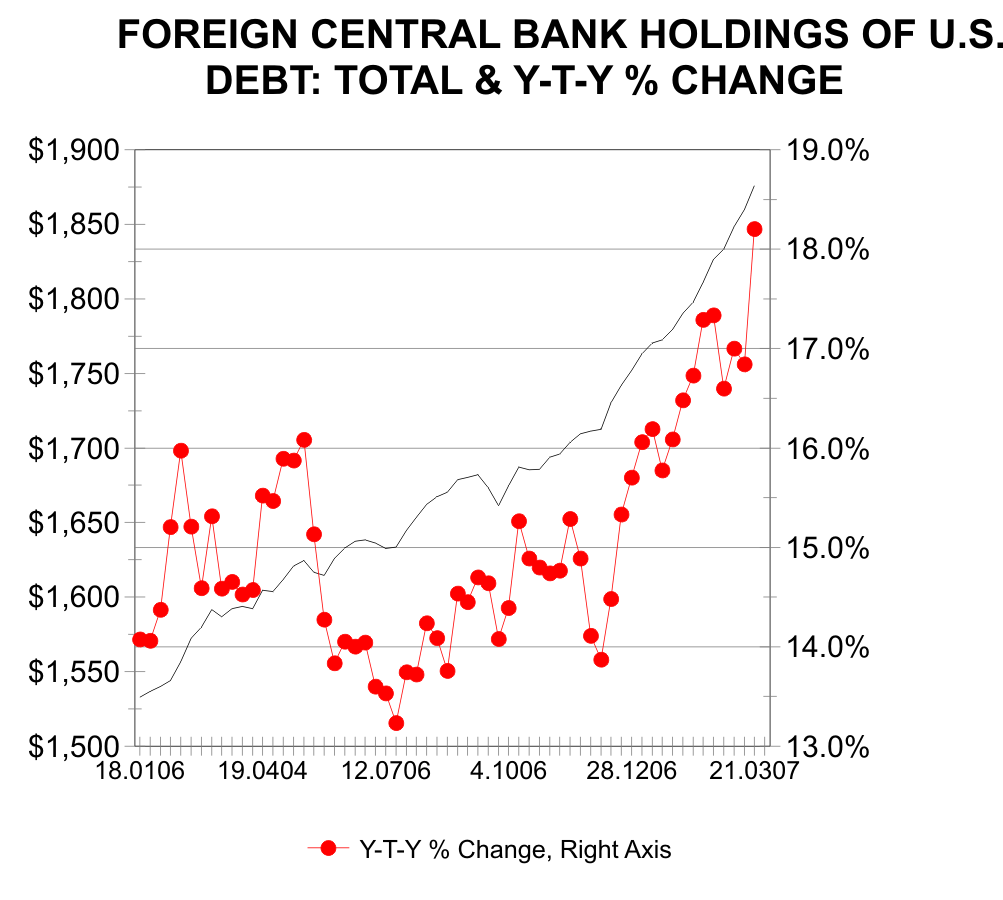
Each week in the release from the Federal Reserve can be found the holdings of U.S. debt by official foreign institutions, essentially central banks. That level of holdings is the solid black line and uses the left axis. Very soon these central banks will own $2 trillion dollars of U.S. government and agency debt. A similarly large pile of this debt is owned by foreign investors other than official institutions. Of more interest is the red line, which is the year-to-year percentage change in the size of these holdings, and uses the right axis .
For some set of reasons, the volume of purchases of U.S. debt by central banks has moved dramatically higher in recent times. In the latest week, holdings were more than 18% higher than a year ago. Without this massive buying of U.S. government debt, the value of the U.S. dollar would already be much lower and Gold much higher. Why has this buying exploded upward? Are central banks truly worried about the value of the U.S. dollar? Is this buying to support the dollar? What happens to the dollar when this buying slows?
Another possible motivation does exist for this rampant buying of U.S. debt by foreign central banks. Second bottom in the year-to-year change line occurred shortly after the U.S. Congressional elections. With those election results, the countdown to U.S. withdrawal from Iraq began. U.S. troops will be out of Iraq, or on their way out, by November of 2008, the month of the U.S. Presidential election. Iraq, and most likely the region, will be plunged into instability at a level never experienced. The theocracy of Iran will be free to act in Iraq as it wishes. Stability of oil production from Saudi Arabia and Kuwait will be a question. Israel and Iran will move toward a resolution of the nuclear weapons balance in the Middle East. Are central banks in the Middle East moving their funds to the U.S. in fear of this threat? These developments and the responses that will follow have a large forecasting error. Investors will not be able to buy Gold at US$650 after the fact.
US$Gold Source: Trading Thoughts, 24 Mar 2007
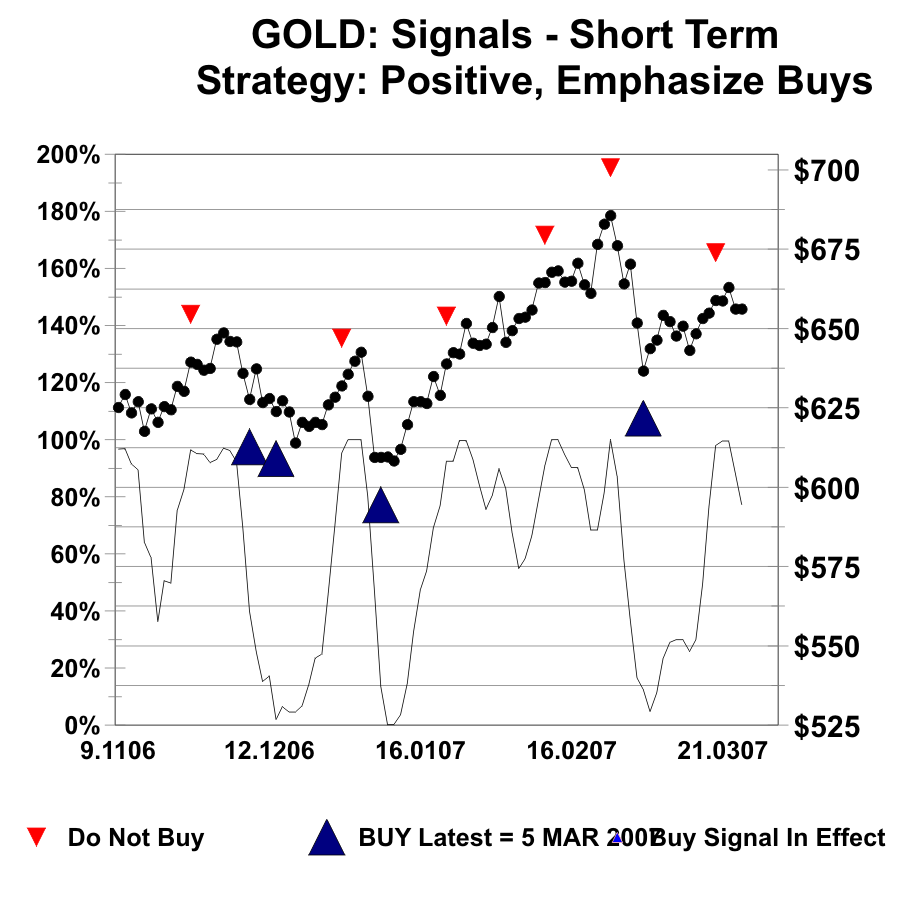
$Gold gave an important short-term buy signal in the past month, though the duration of this over sold condition was not sufficient to cause the intermediate indicator to produce a buy signal. Recently $Gold started to correct that over bought condition, but that process was interrupted. The kidnaping of British soldiers by Iran had not been discounted by the market, and has spurred Gold higher. That action has returned $Gold to over bought. However, investors should always use such developments to their advantage. Each time Gold has moved up on such events it follows with a down move, assuming the world will not actually end as a consequence of this event. Investors should prepare themselves to use that down move, when it develops, to buy Gold.
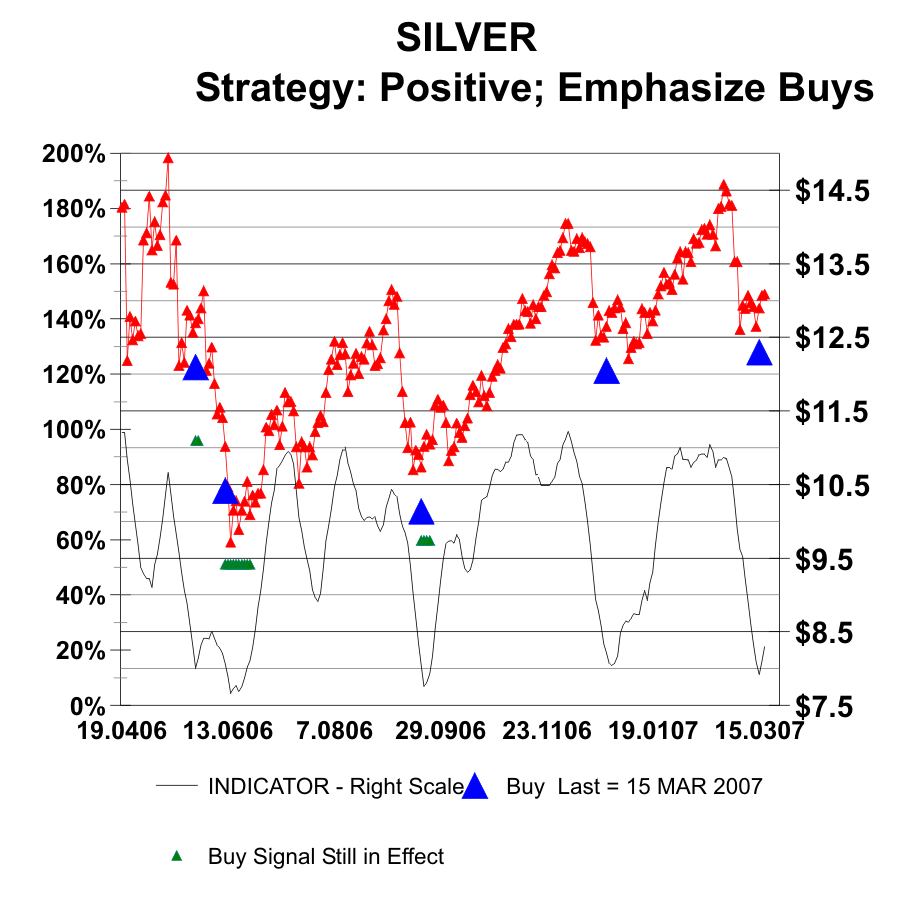
Silver, as shown in the next chart, recently gave an important intermediate buy signal. At current prices, Silver has moved to a short-term over bought condition. Given that Silver is positioning itself for a move to above $15, investors not owning Silver may not want to wait till next buy signal. An averaging approach may be better. With the price of Silver only about fifty cents above the last buy signal that argument has some merit. Additionally, given the experience of the past year, the next buy signal is likely to be at a higher price rather than lower than the current one. SLV might be a good consideration for those new to owning Silver, or those not willing to buy the physical metal.
US$Silver Source: Value View Gold Report, March 2007
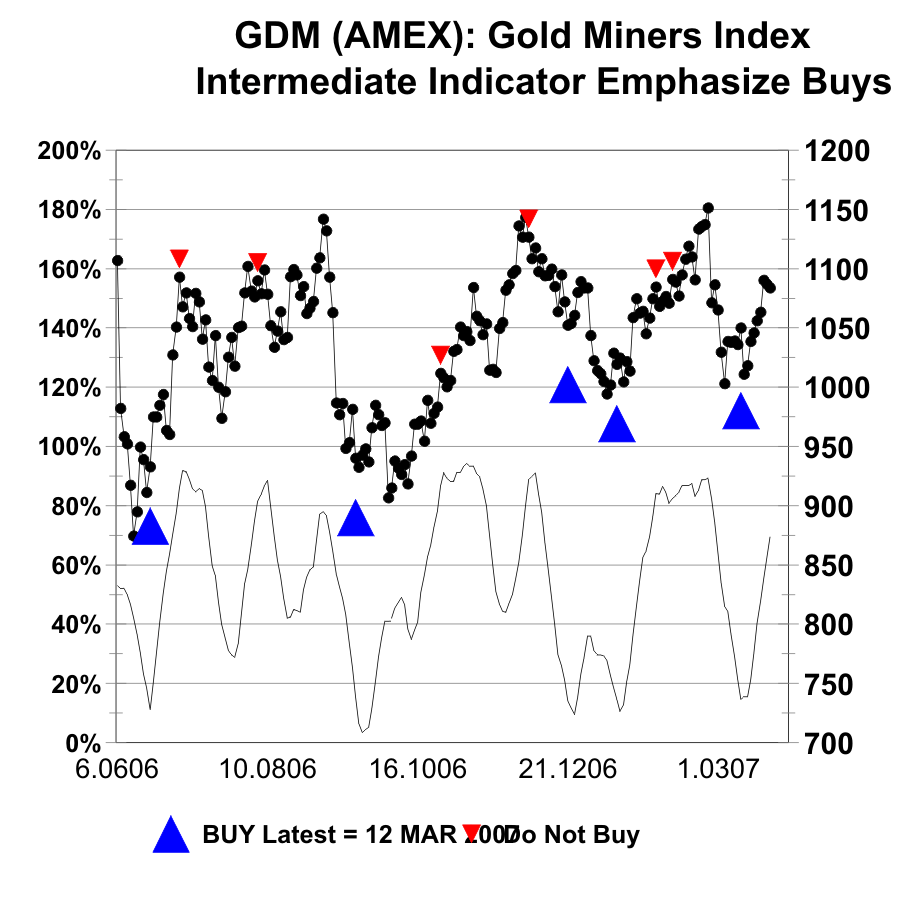
Last chart of is of the GDM, the Gold stock index used for GDX Gold stock ETF, is a excellent picture of the essential price structure throughout the Gold markets. Skepticism has capped the GDM repeatedly at the 1150 level. However, all popular and persistent resistance levels are taken out with a vengeance. Each time this index has sold off an opportunity to buy has been created. The concern for potential buyers is that it has repeated itself so many times that end of the string may be near. A move above 1150 on GDM means the Gold stocks, and Gold, will not look back.
GDM, Index for GTX Source: Trading Thoughts 24 Mar 2007
Too many are thinking that another opportunity to buy Gold, Silver, and the Gold stocks will be created in the future, or that paper equities will survive, With that type of thinking, some do not see need to bother with adding Gold to portfolios at the present. That short sighted thinking is going to cause many investors to find themselves seriously left behind financially. Given the fundamentals for the U.S. dollar and the potential for instability of a historic proportion in the Middle East, Gold is essential for any portfolio. 1400 is a good target price for both U.S. dollar Gold and the NASDAQ Composite Index. And remember, the Gold bugs were the ones that first warned about the collapsing U.S. housing market. And again we were scorned by the cable business media!
By Ned W Schimdt
Editor of THE VALUE VIEW GOLD REPORT
Copyright © 2007 Ned W. Schmidt - All Rights Reserved
Ned W. Schmidt,CFA,CEBS is publisher of THE VALUE VIEW GOLD REPORT and author of "$1,265 GOLD" , published in 2003. A weekly message, TRADING THOUGHTS , is also available to electronic subscribers. You can obtain a copy of the last issue of THE VALUE VIEW GOLD REPORT at http://home.att.net/~nwschmidt/Send_Last_Report.html Ned welcomes your comments and questions, and tries to answer most all. His mission in life is to rescue investors from the abyss of financial assets and the coming collapse of the U.S. dollar. He can be contacted at nwschmidt@earthlink.net.
© 2005-2022 http://www.MarketOracle.co.uk - The Market Oracle is a FREE Daily Financial Markets Analysis & Forecasting online publication.


